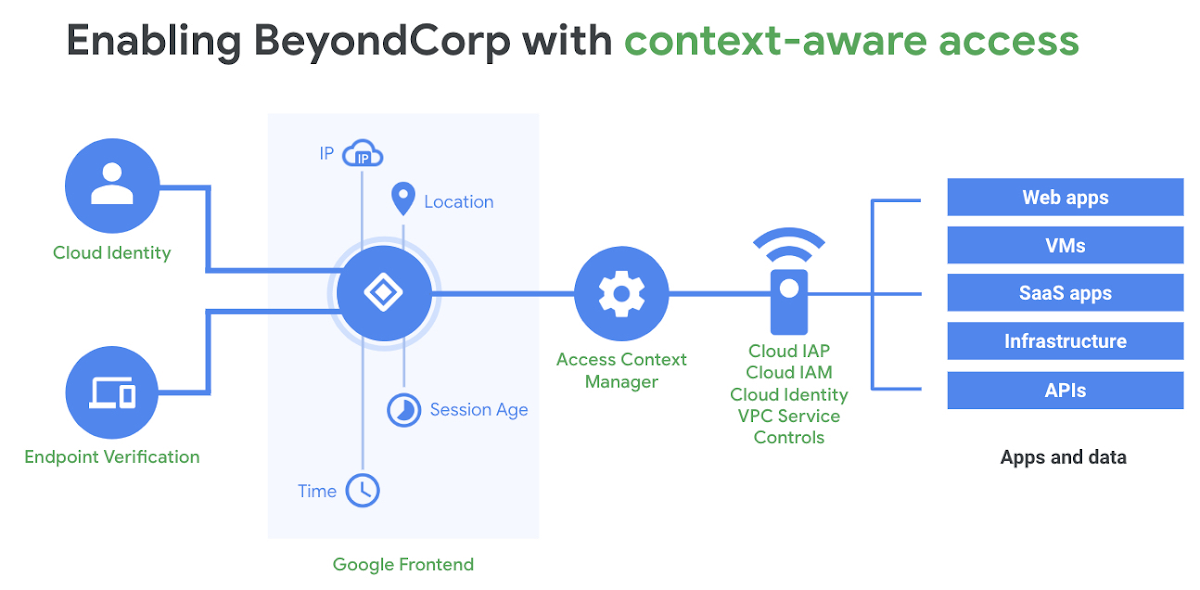
Identity-Aware Proxy (IAP) is a secure method to provide access to internal applications without the use of VPNs. The zero-trust security model builds on Google's BeyondCorp implementation of shifting security from network perimeters to individual users, determining access from the user's context.
On Google Cloud, this can easily be achieved with Cloud IAP (see an example deployment for securing Grafana on GKE). Outside of GCP, there are two great open-source solutions:
A common use case for using an IAP like Pomerium is securing access to internal applications/tools (e.g. Kubernetes dashboard, ArgoCD, Kibana). Kubernetes dashboard, in particular, makes for a great candidate for Pomerium given how no managed Kubernetes services provide a secure dashboard aside from GKE. In 2018, Tesla found crypto-mining malware on their cloud instances, wherein hackers gained access via unsecured Kubernetes dashboard. The default installation now limits access significantly but having users enter in tokens after using the kubectl proxy is a cumbersome process.
- Kubernetes Cluster (e.g. EKS)
- Helm v3
- DNS provider (e.g. Cloudflare)
- Ingress controller (e.g. Traefik)
- Certificate manager (e.g. cert-manager)
NOTE: You can replace Traefik with an ingress controller of your choice (e.g. nginx, envoy, ambassador). Deploy the ingress controller as needed and replace the ingress annotations.
Pomerium consists of four logical components:
- Proxy Service: main proxy to direct users to establish identity
- Authentication Service (AuthN): verify identity via identity provider (IdP)
- Authorization Service (AuthZ): determine permissions
- Cache Service: stores and refreshes IdP access and tokens
While Pomerium can also act as a forward-auth provider (delegate authentication and authorization for each request to Pomerium), we will focus on using Pomerium as a standalone identity-aware proxy since our goal is to make access to the Kubernetes dashboard easy and secure.
Assuming a barebones EKS installation, let's start by deploying metrics-server and kubernetes-dashboard.
Installing metrics-server:
$ kubectl apply -f https://github.com/kubernetes-sigs/metrics-server/releases/download/v0.3.7/components.yaml
Installing kubernetes-dashboard:
$ kubectl apply -f https://raw.githubusercontent.com/kubernetes/dashboard/v2.0.3/aio/deploy/recommended.yaml
While those components are being deployed, create an eks-admin service account and cluster role binding to connect to the dashboard with a token:
eks-admin-service-account.yaml
apiVersion: v1
kind: ServiceAccount
metadata:
  name: eks-admin
  namespace: kube-system
---
apiVersion: rbac.authorization.k8s.io/v1beta1
kind: ClusterRoleBinding
metadata:
  name: eks-admin
roleRef:
  apiGroup: rbac.authorization.k8s.io
  kind: ClusterRole
  name: cluster-admin
subjects:
- kind: ServiceAccount
  name: eks-admin
  namespace: kube-system
Apply the service account and cluster role binding:
$ kubectl apply -f eks-admin-service-account.yaml
Now let's verify that we can log in:
- Start the
kubectl proxy:
$ kubectl proxy
- Grab the token:
$ kubectl -n kube-system get secret $(kubectl -n kube-system get secret | grep eks-admin | awk '{print $1}') --template={{.data.token}} | base64 -D | pbcopy
- Open the link and paste the token:
http://localhost:8001/api/v1/namespaces/kubernetes-dashboard/services/https:kubernetes-dashboard:/proxy/#!/login
This guide will deploy Traefik v2 in High-Availability (HA) and use cert-manager to generate and manage TLS certificates. You can also opt to use Traefik CRDs to integrate Let's Encrypt directly if HA is not a requirement. For deep-dives into the setup, check out:
First, create the traefik namespace:
$ kubectl create namespace traefik
Deploy Traefik with 3 replicas and use NLB on AWS:
$ helm repo add traefik https://containous.github.io/traefik-helm-chart

$ helm install -n traefik traefik traefik/traefik -f traefik/traefik-values.yaml
This example uses Cloudflare to complete DNS challenges, but feel free to use any other supported configurations to work with cert-manager/Let's Encrypt.
Create the cert-manager namespace:
$ kubectl create namespace cert-manager
Deploy cert-manager:
$ helm repo add jetstack https://charts.jetstack.io

$ helm install \
  cert-manager jetstack/cert-manager \
  --namespace cert-manager \
  --version v0.16.0 \
  --set installCRDs=true
Once cert-manager is up and running, create an Issuer and generate a wildcard certificate for your domain (make sure to replace appropriate values under cert-manager/cluster-issue.yaml and wildcard-cert.yaml):
$ kubectl apply -f cert-manager/cluster-issuer.yaml

$ kubectl apply -f cert-manager/wildcard-cert.yaml
Verify that the cert has been issued:
$ kubectl describe certificate wildcard-cert
Now we need to configure an Identity Provider to determine user access. Pomerium supports Azure AD, AWS Cognito, GitHub, GitLab, Google / GSuite, Okta, and OneLogin. I'll be using Google in this example, but configure as needed for your provider: https://www.pomerium.io/docs/identity-providers/
-
Login to Google Cloud and go to APIs & Services. Select a project to generate the OAuth token.
-
Click
Credentialson the left-hand menu and clickCreate credentials->OAuth client ID -
Configure the
Consent Screen, choosingInternaland setting support email -
Create an OAuth client ID, setting
Web applicationas the Application type -
Under
Authorized redirect URIsput in the following:https://authenticate.<my-domain>/oauth2/callback(replace my-domain with domain you generated the wildcard cert for) -
Click
Createand make note of theclient IDandclient secret
Finally, we can configure Pomerium to act as an IAP to access the Kubernetes dashboard. Add the clientID and clientSecret from above to the idp section. Generate sharedSecret and cookieSecret:
$(head -c32 /dev/urandom | base64)
Configure the rootDomain as the domain we generated the wildcard cert for. It's important to note that we are setting generateTLS as false and insecure as true to allow Traefik to do SSL termination and allow Pomerium to accept Kubernetes dashboard's self-sign cert.
Add the EKS token generated to access the Kubernetes dashboard from the very first step into the Authorization header. Once the values file has been updated, deploy Pomerium via Helm:
$ helm repo add pomerium https://helm.pomerium.io

$ helm install pomerium pomerium/pomerium -f pomerium/pomerium-values.yaml
Once Pomerium pods are running and the Ingress has been created, grab the URL for the NLB created by Traefik. Point the CNAME for subdomains authenticate and name used for the dashboard to NLB.
Now once you hit the URL of the dashboard, you'll be redirected to the Identity Provider's login page (in our case Google). If the user is in our domain and successfully logs in, Pomerium will forward the bearer token to the dashboard and the user will have access to the dashboard without having to enter in the token.
