Name
双指数平均线交叉量化交易策略Dual-Exponential-Moving-Average-Crossover-Algorithmic-Trading-Strategy
Author
ChaoZhang
Strategy Description
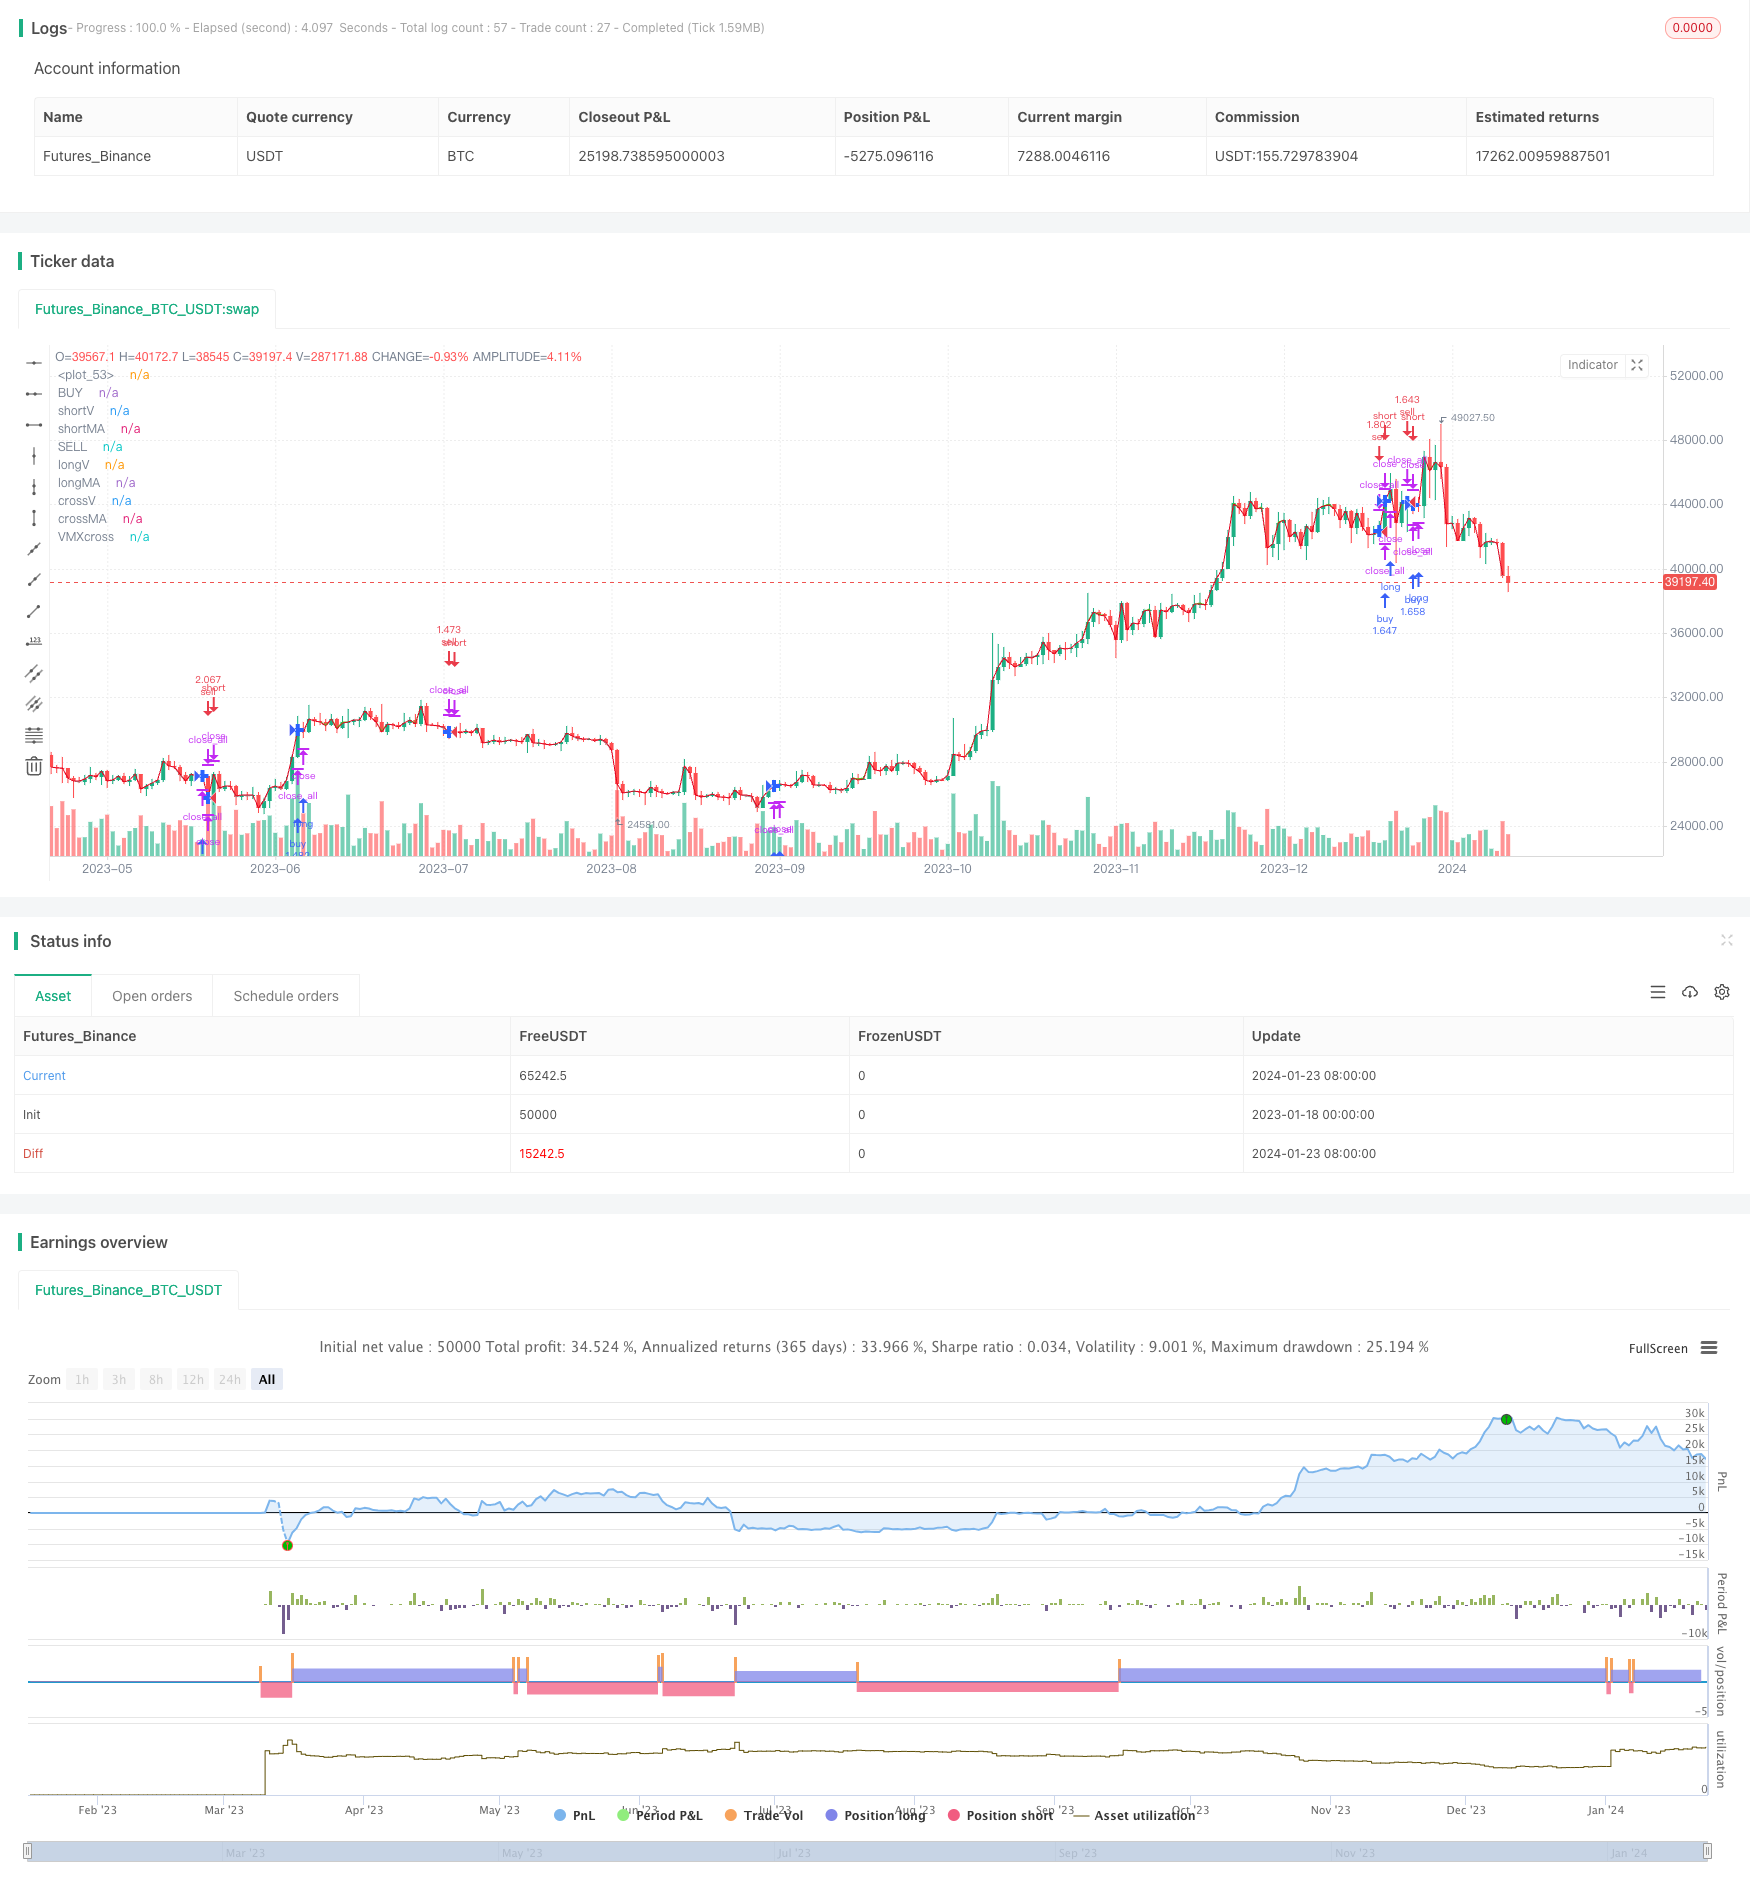
本策略名称为“双指数平均线交叉量化交易策略”。该策略通过计算双指数移动平均线(Exponential Moving Average, EMA)并进行交叉买卖点判断,结合量化交易开仓原理,实现自动化交易。
本策略核心逻辑基于双指数移动平均线。指标1为短期20日EMA,指标2为长期50日EMA。当短期EMA从下方上穿长期EMA时产生买入信号;当短期EMA从上方下穿长期EMA时产生卖出信号。这样利用EMA不同参数的交叉来判断市场买卖点。
此外,策略还使用Vortex量化指标来辅助判断趋势和产生交易信号。Vortex指标通过计算最高价与昨日收盘价、最低价与昨日收盘价的差值比较判断涨跌力道,参数周期为1日和3日。结合Vortex指标可过滤掉部分非主要趋势的EMA信号。
在交易信号产生时,根据策略内置的资金管理模块,结合盈亏比例原理进行风险管理。策略允许设置止损位和止盈位来锁定盈利,以控制风险。
-
- 策略整合双EMA交叉和Vortex量化指标,充分利用指标优势,提高信号准确性
-
- 自动化交易系统,无需人工参与,降低人为失误概率
-
- 内置自动止损止盈功能,可以限制单笔交易最大Loss
-
- 资金管理模块控制每个交易的投入资金比例,从而控制总体交易风险
-
- EMA交叉信号可能出现假信号,Vortex量化指标也无法完全过滤假信号,所以会存在一定亏损概率
-
- 突发重大黑天鹅事件可能直接扩大单笔交易亏损
-
- 回撤控制依赖止损功能,如果突破止损会造成更大损失
优化方向:
-
- 可以测试调整EMA参数,优化交叉信号
-
- 可以结合更多指标过滤信号
-
- 可以通过机器学习算法自动优化参数
本策略总体而言是一个典型的双EMA交叉策略,利用EMA不同参数之间的交叉来判断市场买卖时机,属于中短线交易策略。策略最大的优势在于利用量化指标进行信号过滤,并通过自动化交易系统实现无人值守,同时内置止损止盈来控制风险,表现相对稳定。后期可通过参数优化以及引入更多辅助指标来进一步提高策略效果。
||
The strategy is named "Dual Exponential Moving Average Crossover Algorithmic Trading Strategy". It calculates dual exponential moving averages (EMA) and generates trading signals when the EMAs cross over. Combined with the algorithmic trading principles for order entry, it automates the entire trading process.
The core logic of this strategy is based on the dual EMA crossovers. Indicator 1 is the 20-day EMA and Indicator 2 is the 50-day EMA. A buy signal is generated when the shorter-term EMA crosses over the longer-term EMA from below. A sell signal is generated when the shorter-term EMA crosses below the longer-term EMA from above. So the crossover of EMAs with different parameters is used to determine market entry and exit points.
In addition, the Vortex indicator is used to aid in identifying the trend and generating trading signals. The Vortex indicator determines the bullish or bearish momentum by comparing the difference between the highest price and yesterday's close, and the lowest price and yesterday's open, over a 1-day and 3-day period. Using the Vortex can help filter out some less significant signals from the EMA crosses.
When a trading signal is generated, the built-in money management module helps manage risks by controlling position sizing based on predefined profit loss ratios. Stop loss and take profit levels can also be set to lock in profits and limit downsides.
-
The strategy integrates dual EMA crossovers and the Vortex indicator to take advantage of both, thus improving signal accuracy
-
The automated trading system removes emotional human errors and minimizes risks
-
The auto stop loss/take profit functions limit max loss for each trade
-
The money management module controls capital allocation for each trade, thus manages overall risks
-
EMA crossovers may generate false signals. And the Vortex indicator cannot completely filter out false signals either. There can still be some losing trades.
-
Black swan events can lead to huge losses on open positions.
-
The strategy relies on stop losses to control drawdowns. If stopped out, losses may exceed expectations.
Improvement Opportunities:
-
EMA parameters can be further optimized to improve signal quality
-
More indicators may be added to better filter signals
-
Machine learning algorithms may help auto-optimize parameters
Overall this is a typical dual EMA crossover strategy for medium-term trading. It identifies trading opportunities from EMA crossovers. The biggest advantage lies in using indicators like the Vortex to filter signals, executing the automated strategy reliably, plus the embedded stop loss/take profit functions to mitigate risks. Going forward, strategy performance may be further enhanced through parameter tuning and integrating more complementary indicators.
[/trans]
Strategy Arguments
| Argument | Default | Description |
|---|---|---|
| v_input_1 | 15 | short Time |
| v_input_2 | 25 | long time |
| v_input_3 | 5 | Vortex Power |
| v_input_4 | 20 | ShortMa |
| v_input_5 | 29 | LongMA |
| v_input_6 | true | Vortex Stabilize |
| v_input_7 | true | MACross Stabilize |
| v_input_8 | false | Stop Loss Long |
| v_input_9 | true | Stop Long |
| v_input_10 | false | Take Profit Long |
| v_input_11 | true | Take Long |
| v_input_12 | false | Stop Loss Short |
| v_input_13 | true | Stop Short |
| v_input_14 | false | Take Profit Short |
| v_input_15 | true | Take Short |
Source (PineScript)
/*backtest
start: 2023-01-18 00:00:00
end: 2024-01-24 00:00:00
period: 1d
basePeriod: 1h
exchanges: [{"eid":"Futures_Binance","currency":"BTC_USDT"}]
*/

// This source code is subject to the terms of the Mozilla Public License 2.0 at https://mozilla.org/MPL/2.0/
// © smottybugger

//@version= 5
strategy("The  Averages Moving_X_Vortex", shorttitle="2.5billion BTC lol" , calc_on_order_fills=true, calc_on_every_tick=true, commission_type=strategy.commission.percent, commission_value=0.02, default_qty_type=strategy.percent_of_equity, default_qty_value=100, initial_capital=100, margin_long=0, margin_short=0,overlay=true)
// Dual Vortex
period_1 = input(15, "short Time")
period_2 = input(25, "long time")
VMP = math.sum(math.abs(high - low[3]), period_1)
VMM = math.sum(math.abs(low - high[1]), period_2)
STR = math.sum(ta.atr(1), period_1)
STR2 = math.sum(ta.atr(1), period_2)
VXpower= (input(5,"Vortex Power")/10000)*close
shorterV =(VMP / STR)*VXpower
longerV = (VMM / STR2)*VXpower

// MACross
shortlen = input(20, "ShortMa")
longlen = input(29, "LongMA")
shorterMA = ta.sma(close, shortlen)
longerMA = ta.sma(close, longlen)

// Vortex "MACross Stabilized"
Varance = input(1, "Vortex Stabilize")
Vpercent = (Varance / 100)
shortV= ((((shorterMA-close)* Vpercent)+shorterV)/2)+close
longV = ((((longerMA -close )*Vpercent)+longerV)/2)+close

//MAcross vortex stabilized
Marance = input(1, "MACross Stabilize")
MApercent = Marance / 100
shortMA = ((((shorterMA-close)*MApercent)+shorterV)/2)+close
longMA = ((((longerMA-close)*MApercent)+longerV)/2)+close

//VMXadveraged Moving cross adveraged
VMXL=(longV+longMA)/2
VMXS=(shortV+shortMA)/2
VXcross= ta.cross(VMXS,VMXL) ? VMXS : na
VMXcross= ta.cross(VMXS,VMXL)

//plot
plot(VMXS,"BUY",color=#42D420)
plot(VMXL,"SELL",color=#e20420)
crossV= ta.cross(shortV, longV) ? shortV : na
plot(shortV ,"shortV", color=#42D420)
plot(longV,"longV", color=#e20420)
plot(crossV,"crossV", color=#2962FF, style=plot.style_cross, linewidth=4)
crossMA = ta.cross(shortMA, longMA) ? shortMA : na
plot(shortMA,"shortMA", color=#42D420)
plot(longMA,"longMA", color=#e20420)
plot(crossMA,"crossMA", color=#2962FF, style=plot.style_cross, linewidth=4)
plot(VXcross,"VMXcross",color=#2962FF, style= plot.style_cross,linewidth=4)
plot(close,color=#999999)

// Vortex Condistyle
is_Vlong =shortV< longV
is_Vshort =shortV>longV


// Vortex commands
Vlong =  ta.crossunder(longV, shortV)
Vshort =ta.crossover(shortV,longV)
VorteX = ta.cross(longV, shortV)

// MACross Conditions
is_MAlong = shortMA < longV
is_MAshort = shortMA > shortV


//VMX Conditions
is_VMXlong=VMXS<VMXL
is_VMXshort=VMXS>VMXL

// MA commands
MAlong = ta.crossunder(shortMA, longV)
MAshort =ta.crossover(shortMA, shortV)
MAcross =  ta.cross(shortMA, longMA)

//VMX COMMANss
VMXBUY=ta.crossover( VMXS,VMXL)
VMXSELL=ta.crossunder(VMXS,VMXL)

// Close Crossing PositionLMXs

CS=is_MAshort or is_VMXshort
CL= is_MAlong or is_VMXlong
OS=MAshort or VMXSELL
OL=MAlong or VMXBUY


if VMXcross
    strategy.close_all ("closed")

//if CS and  OL
    strategy.close("Short",comment="Short Closed")


//if CL and  OS
    strategy.close("Long",comment="Long Closed" )

//CA1= is_MAcross and is_VorteX
//if CA1
   // strategy.close_all(comment="X2X")

// Defalongyntry qty

if is_VMXlong and VMXSELL
    strategy.entry("sell",strategy.short)


if is_VMXshort and VMXBUY
    strategy.entry("buy",strategy.long)


// Stop Losses & Taking Profit
sllp = input(0, "Stop Loss Long")
sll = (1 - sllp / 100) * strategy.position_avg_price
is_sll = input(true, "Stop Long")

tplp = input(0, "Take Profit Long")
tpl = (1 + tplp / 100) * strategy.position_avg_price
is_tpl = input(true, "Take Long")

slsp = input(0, "Stop Loss Short")
sls = (1 + slsp / 100) * strategy.position_avg_price
is_sls = input(true, "Stop Short")

tpsp = input(0, "Take Profit Short")
tps = (1 - tpsp / 100) * strategy.position_avg_price
is_tps = input(true, "Take Short")

if (is_sll or is_sls)
    strategy.close("Stop Losses", qty_percent=100)

if (is_tpl or is_tps)
    strategy.close("Take Profits", qty_percent=100)


 //Strategy Backtest
//plot(strategy.equity, "Equity", color=color.red, linewidth=2, style=plot.style_areabr)
Detail
https://www.fmz.com/strategy/439969
Last Modified
2024-01-25 14:04:23