Name
基于均线金叉突破动量策略Dual-Moving-Average-With-Momentum-Breakout-Strategy
Author
ChaoZhang
Strategy Description
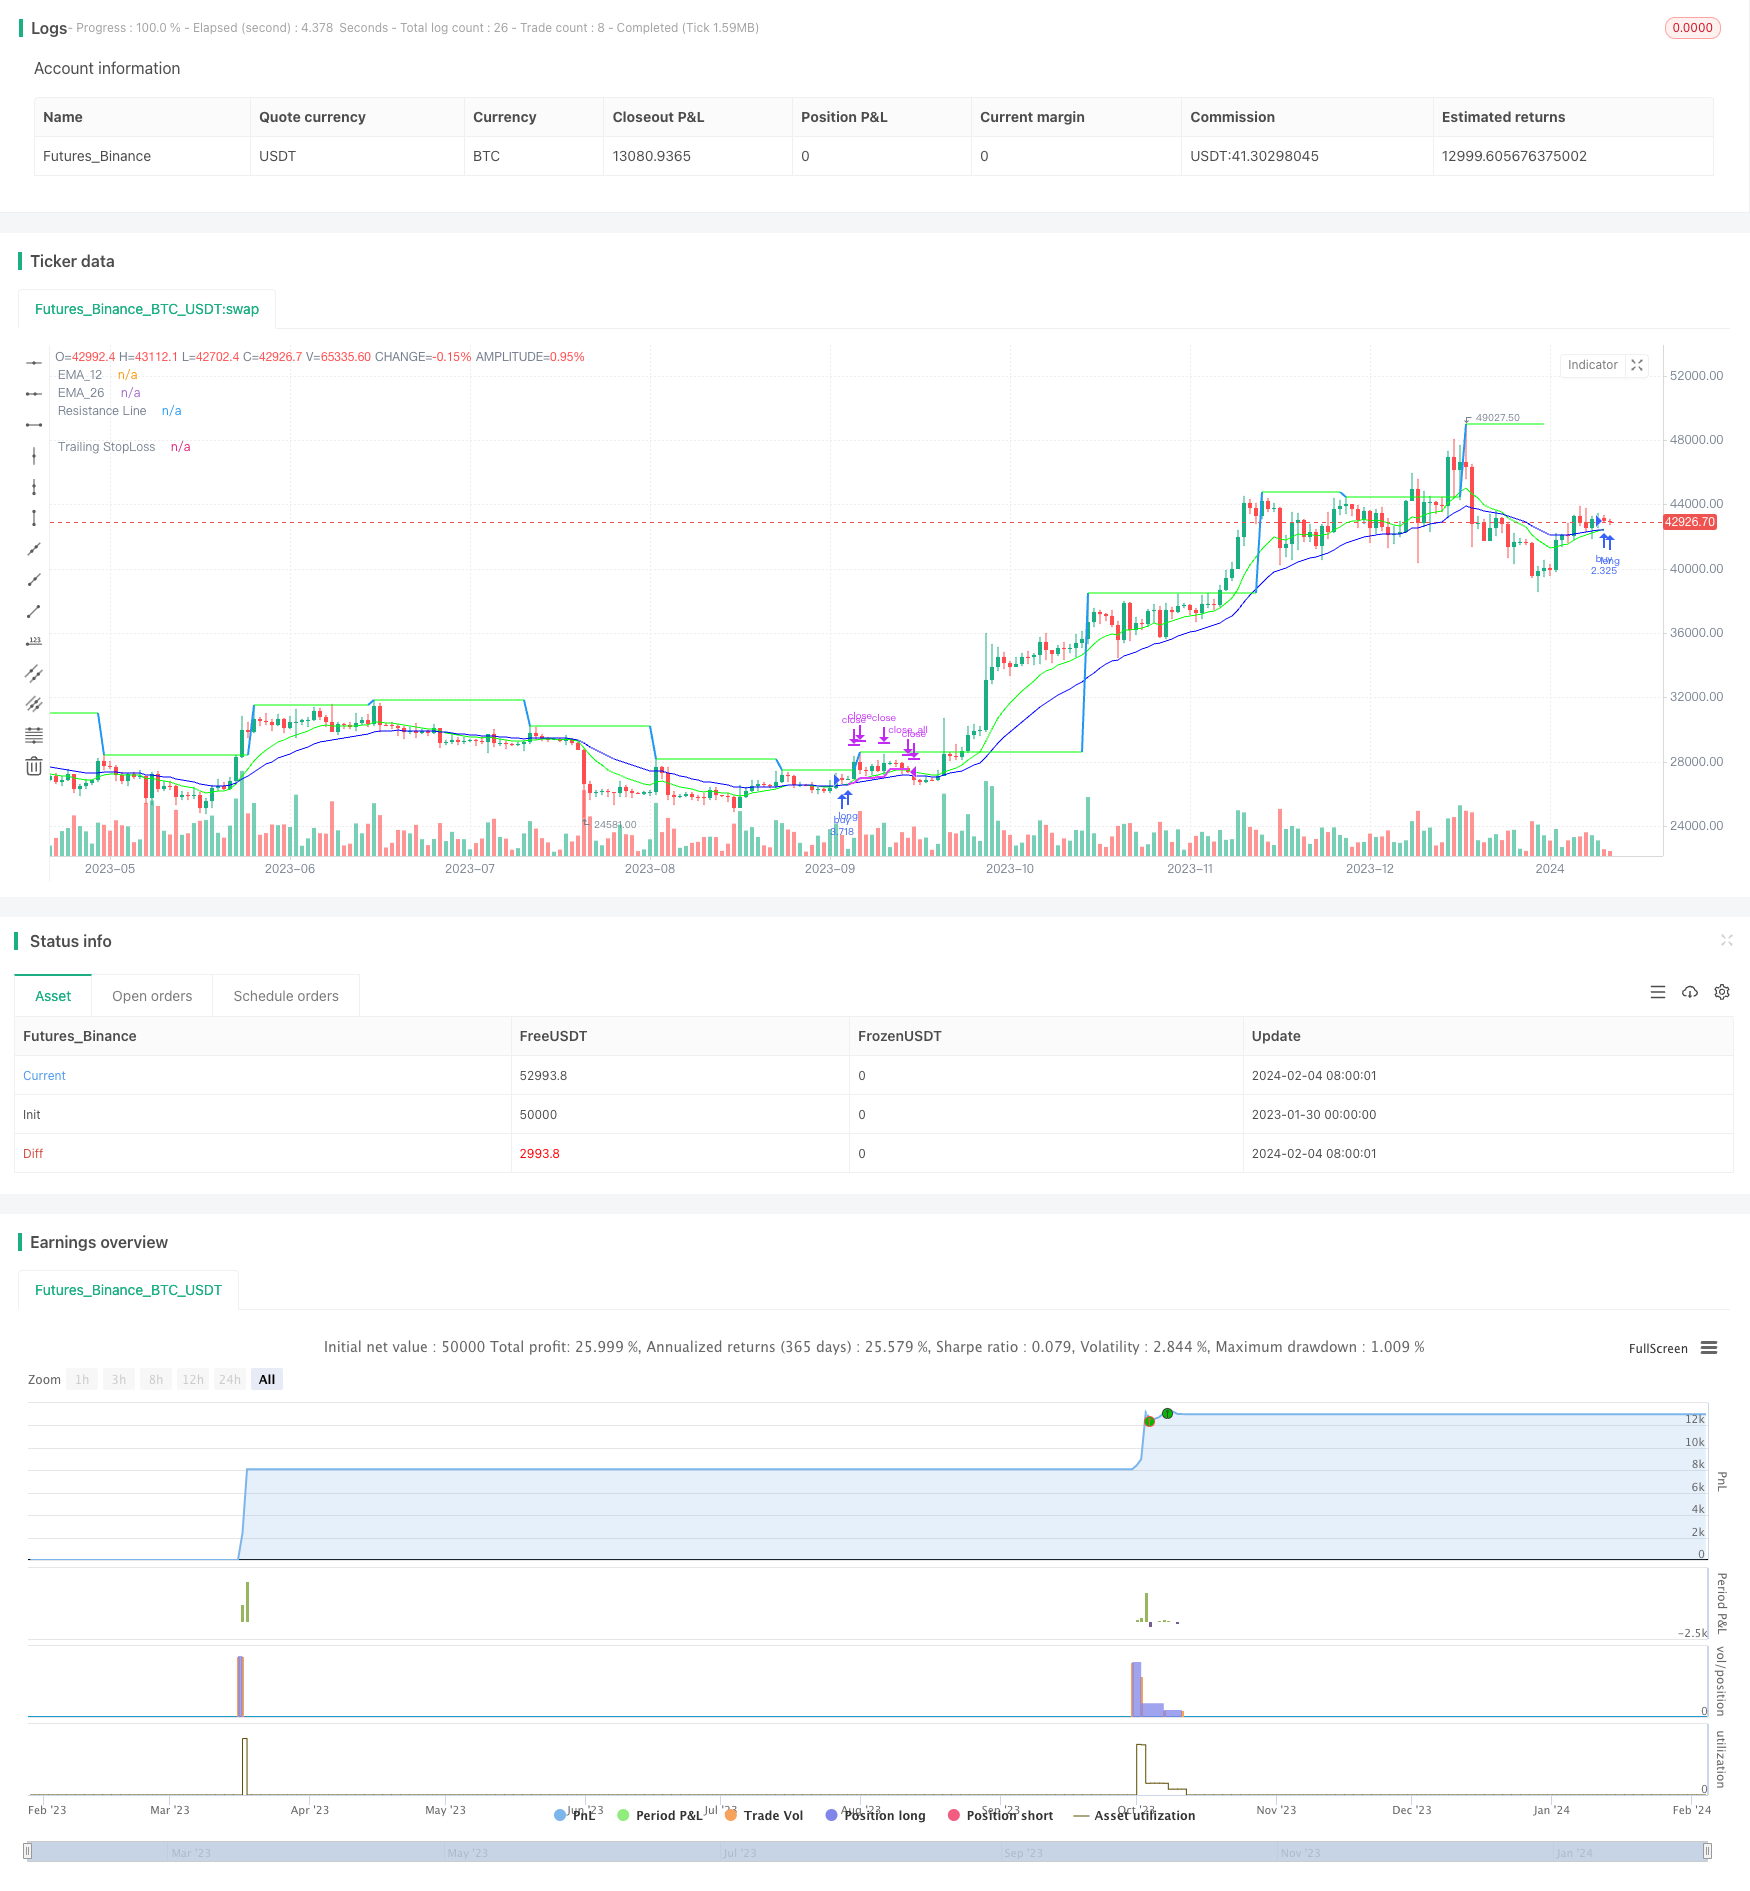
本策略基于12日指数移动平均线(EMA)和26日EMA的金叉作为入场信号。为了过滤假突破,策略还引入MACD指标判断市场趋势以及RSI指标判断是否处于超买超卖区域。同时,策略还会判断价格是否突破阻力位来确认趋势。
在止损方面,策略提供三种可选方案:跟踪止损、均线止损和均线叉死。在止盈方面,策略提供两个顺序止盈目标。
-
入场信号
- 12日EMA上穿26日EMA构成金叉
- MACD指标为正,且MACD线高于Signal线
- RSI指标值介于设定的区间内
- 收盘价高于21日EMA和7日SMA
-
入场确认
- 可选判断:价格突破动态阻力位
-
止损方式
- 跟踪止损:根据入场价格和设定的跟踪止损百分比跟踪设置止损位
- 均线止损:收盘价跌破7日SMA止损
- 均线叉死:12日EMA下穿26日EMA止损
-
止盈方式
- 设定两个顺序止盈目标,当第一个止盈位触发后卖出部分数量,当第二个止盈位触发后卖出全部数量
- 使用均线系统过滤误导信号,提高入场准确率
- 多种可选的止损方式适应不同类型交易者
- 动态跟踪止损实现风险控制
- 止盈目标分批出场,锁定部分利润
- 市场震荡时,EMA指标产生较多假信号
- 跟踪止损在突破上行后可能被突破
- 均线叉死止损在趋势反转时无法及时止损
对应措施:
- 结合MACD指标判断市场实际走势
- 调整跟踪止损的幅度
- 选用其他止损方式或结合止损
- 对EMA参数进行优化,确定最佳参数组合
- 测试不同的止损方式及参数,找到最佳止损方案
- 测试不同的止盈参数,优化止盈效果
- 结合其他指标判断入场时机
- 根据不同品种、周期参数进行调整
本策略以均线系统为主要交易信号,辅助以MACD、RSI等指标进行入场过滤。止损方式和止盈目标都进行了优化设定,可以通过参数调整匹配不同类型投资者。策略优化空间还很大,可以从入场信号、止损方式、止盈目标等多个维度进行测试和改进,使策略效果更好。
||
This strategy uses the golden cross of 12-day EMA and 26-day EMA as the entry signal. To filter false breakouts, MACD is applied to judge market trend and RSI for overbought/oversold levels. Price breakout above resistance is also used as confirmation.
The strategy provides three optional stop loss methods: trailing stop loss, moving average stop and moving average crossover stop. Two take profit targets are set.
- Entry Signal
- Golden cross between 12-day EMA and 26-day EMA
- MACD is positive and MACD line above Signal line
- RSI within preset range
- Entry Confirmation
- Optional: Price breakout above dynamic resistance
- Stop Loss
- Trailing stop loss based on entry price and preset percentage
- Close below 7-day SMA
- Bearish cross between 12-day and 26-day EMA
- Take Profit
- Two staged take profit targets, exit partial position on first target and all on second
- MA system filters false signals, improves entry accuracy
- Multiple stop loss options for different trader style
- Dynamic trailing stop controls risks
- Take profit in stages locks in some profit
- More false signals when market oscillates
- Trailing stop may be penetrated after strong run
- Fail to exit timely on trend reversal
Solutions:
- Use MACD to judge real trend
- Adjust trailing percentage
- Use other stop methods or combine stops
- Optimize MA parameters for best performance
- Test different stops and find best method
- Adjust take profit levels for better reward
- Add filters with other indicators
- Customize for different products and timeframes
The strategy uses MA system for entry signal, with additional filters by MACD, RSI etc. Both stops and profit targets are optimized for matching different trader style. There is still large room for optimization on entry timing, stop method, take profit level etc. to further improve performance.
[/trans]
Strategy Arguments
| Argument | Default | Description |
|---|---|---|
| v_input_5 | 100000 | BUYVALUE |
| v_input_bool_1 | true | (?Entry_Exit Criteria)Show_Only_12_26_Crossover_Entry |
| v_input_bool_2 | false | Show_12_26_Crossover_and_resistance_Entry |
| v_input_bool_3 | true | Show_TSL_StopLoss |
| v_input_bool_4 | true | Show_Crossdown_StopLoss |
| v_input_bool_5 | false | Show_SMA7_StopLoss |
| v_input_float_1 | 5 | (?Target-1)Target (%) |
| v_input_int_1 | 50 | Target1_exit_qty |
| v_input_float_2 | 10 | (?Target-2)Target (%) |
| v_input_int_2 | 100 | Target2_exit_qty |
| v_input_1_low | 0 | (?Trailing StopLoss)TSL Source: low |
| v_input_float_3 | true | Trail Long Loss (%) |
| v_input_int_3 | 10 | (?RESISTANCE)CrossOverLookbackCandles |
| v_input_2_high | 0 | resistanceSRC: high |
| v_input_3 | 10 | resistanceLEFT |
| v_input_4 | 10 | resistanceRIGHT |
| v_input_int_4 | 50 | (?RSI)RSILowerRange |
| v_input_int_5 | 70 | RSIUpperRange |
Source (PineScript)
/*backtest
start: 2023-01-30 00:00:00
end: 2024-02-05 00:00:00
period: 1d
basePeriod: 1h
exchanges: [{"eid":"Futures_Binance","currency":"BTC_USDT"}]
*/

// This source code is subject to the terms of the Mozilla Public License 2.0 at https://mozilla.org/MPL/2.0/
// © AbdulRahimShama
//@version=5


strategy('12/26-IT strategy', overlay=true,initial_capital = 100000)


Show_Only_12_26_Crossover_Entry = input.bool(true, group = "Entry_Exit Criteria")
Show_12_26_Crossover_and_resistance_Entry = input.bool(false, group = "Entry_Exit Criteria")


Show_TSL_StopLoss = input.bool(true, group = "Entry_Exit Criteria")
Show_Crossdown_StopLoss = input.bool(true, group = "Entry_Exit Criteria")
Show_SMA7_StopLoss = input.bool(false, group = "Entry_Exit Criteria")


////////////////////////////////////////////////
////////////////TARGETS INPUT
////////////////////////////////////////////////

////////Target1

TargetPerc1 = input.float(title="Target (%)", minval=0,defval=5, group="Target-1") / 100
TargetPrice1 = strategy.position_avg_price * (1 + TargetPerc1)
Target1_exit_qty = input.int(50, group="Target-1",tooltip = "% qty to sell when Target1 is reached")


////////Target2

TargetPerc2 = input.float(title="Target (%)", minval=0,defval=10, group="Target-2") / 100
TargetPrice2 = strategy.position_avg_price * (1 + TargetPerc2)
Target2_exit_qty = input.int(100, group="Target-2",tooltip = "% qty to sell when Target2 is reached")


////////////////////////////////////////////////
////////////////TRAILING STOP LOSS
////////////////////////////////////////////////


TSLsource = input(low, title="TSL Source", group="Trailing StopLoss")

longTrailPerc = input.float(title='Trail Long Loss (%)', minval=0.0, step=0.1, defval=1, group="Trailing StopLoss") * 0.01

TrailStopPrice = 0.0

TrailStopPrice := if strategy.position_size > 0
    sPIVOT_highValue = TSLsource * (1 - longTrailPerc)
    math.max(sPIVOT_highValue, TrailStopPrice[1])
else
    0

TSL = close < TrailStopPrice
plot(series=strategy.position_size > 0 and Show_TSL_StopLoss ? TrailStopPrice : na, color=color.new(color.fuchsia, 0), style=plot.style_linebr, linewidth=2, title='Trailing StopLoss')


////////////////////////////////////////////////
////////////////Moving Averages
////////////////////////////////////////////////


EMA_12=ta.ema(close, 12)
EMA_26=ta.ema(close, 26)
EMA_21=ta.ema(close,21)

plot(EMA_12, title="EMA_12", color=color.rgb(0, 255, 0), offset=0, linewidth=1)
plot(EMA_26, title="EMA_26", color=color.rgb(0, 0, 255), offset=0, linewidth=1)
plot(Show_SMA7_StopLoss ? ta.sma(close,7) : na, title="SMA_7", color=color.rgb(255, 0, 0), offset=0, linewidth=1)


////////////////////////////////////////////////
////////////////RESISTANCE INPUT and PLOTTING
////////////////////////////////////////////////

CrossOverLookbackCandles = input.int(10, group= "RESISTANCE")

resistanceSRC = input(high, group= "RESISTANCE")
resistanceLEFT = input(10, group= "RESISTANCE")
resistanceRIGHT = input(10, group= "RESISTANCE")

hih = ta.pivothigh(resistanceSRC, resistanceLEFT, resistanceRIGHT)
top = ta.valuewhen(hih, resistanceSRC[resistanceRIGHT], 0)

res = plot(top, color=top != top[1] ? na : color.new(#00ff00, 50), offset=-resistanceLEFT, linewidth=2, title="Resistance Line")

EMA_12_Low = ta.lowest(EMA_12, CrossOverLookbackCandles)
EMA_26_Low = ta.lowest(EMA_26, CrossOverLookbackCandles)


////////////////////////////////////////////////
////////////////RSI INPUT and PLOTTING
////////////////////////////////////////////////
RSI = ta.rsi(close, 14)
RSILowerRange = input.int(50, tooltip = "RSI value should be ABOVE this value for entry", group = "RSI")
RSIUpperRange = input.int(70, tooltip = "RSI value should be BELOW this value for entry", group = "RSI")


////////////////////////////////////////////////
////////////////MACD
////////////////////////////////////////////////
fast_length = 12
slow_length = 26
MACD_src = close
signal_length = 9

fast_ma = ta.ema(MACD_src, fast_length)
slow_ma = ta.ema(MACD_src, slow_length)
macd = fast_ma - slow_ma
signal = ta.ema(macd, signal_length)
hist = macd - signal


////////////////////////////////////////////////
////////////////ENTRY CRITERIA
////////////////////////////////////////////////


BUYVALUE= input(100000, tooltip = "Buy qty displayed on chart will be based on this value")

BASEENTRY = macd > signal and RSI > RSILowerRange and RSI < RSIUpperRange and close > EMA_21 and close > ta.sma(close, 7)


Entry= ta.crossover(EMA_12, EMA_26) and BASEENTRY
Entry2 = ta.crossover(close, top) and EMA_12_Low < EMA_26_Low and EMA_12 > EMA_26 and RSI < 70

////////////////////////////////////////////////
////////////////BUY SELL STRATEGY
////////////////////////////////////////////////

if ((Entry and Show_Only_12_26_Crossover_Entry))
    strategy.entry("buy", strategy.long, qty=BUYVALUE/close)

if (Entry2 and Show_12_26_Crossover_and_resistance_Entry)
    strategy.entry("buy", strategy.long, qty=BUYVALUE/close)

strategy.exit("Tg1", "buy", limit=TargetPrice1, qty_percent = Target1_exit_qty)
strategy.exit("Tg2", "buy", limit=TargetPrice2, qty_percent = Target2_exit_qty)


if TSL and Show_TSL_StopLoss and close < EMA_12
    strategy.close_all ("sl")

if ta.crossunder(EMA_12, EMA_26) and Show_Crossdown_StopLoss
    strategy.close_all ("sl")

if ta.crossunder(close, ta.sma(close, 7)) and Show_SMA7_StopLoss
    strategy.close_all ("sl")
Detail
https://www.fmz.com/strategy/441177
Last Modified
2024-02-06 14:39:22