Name
基于布林通道和RSI指标的渐进DCA策略Bollinger-Band-and-RSI-Mixing-with-DCA-Strategy
Author
ChaoZhang
Strategy Description
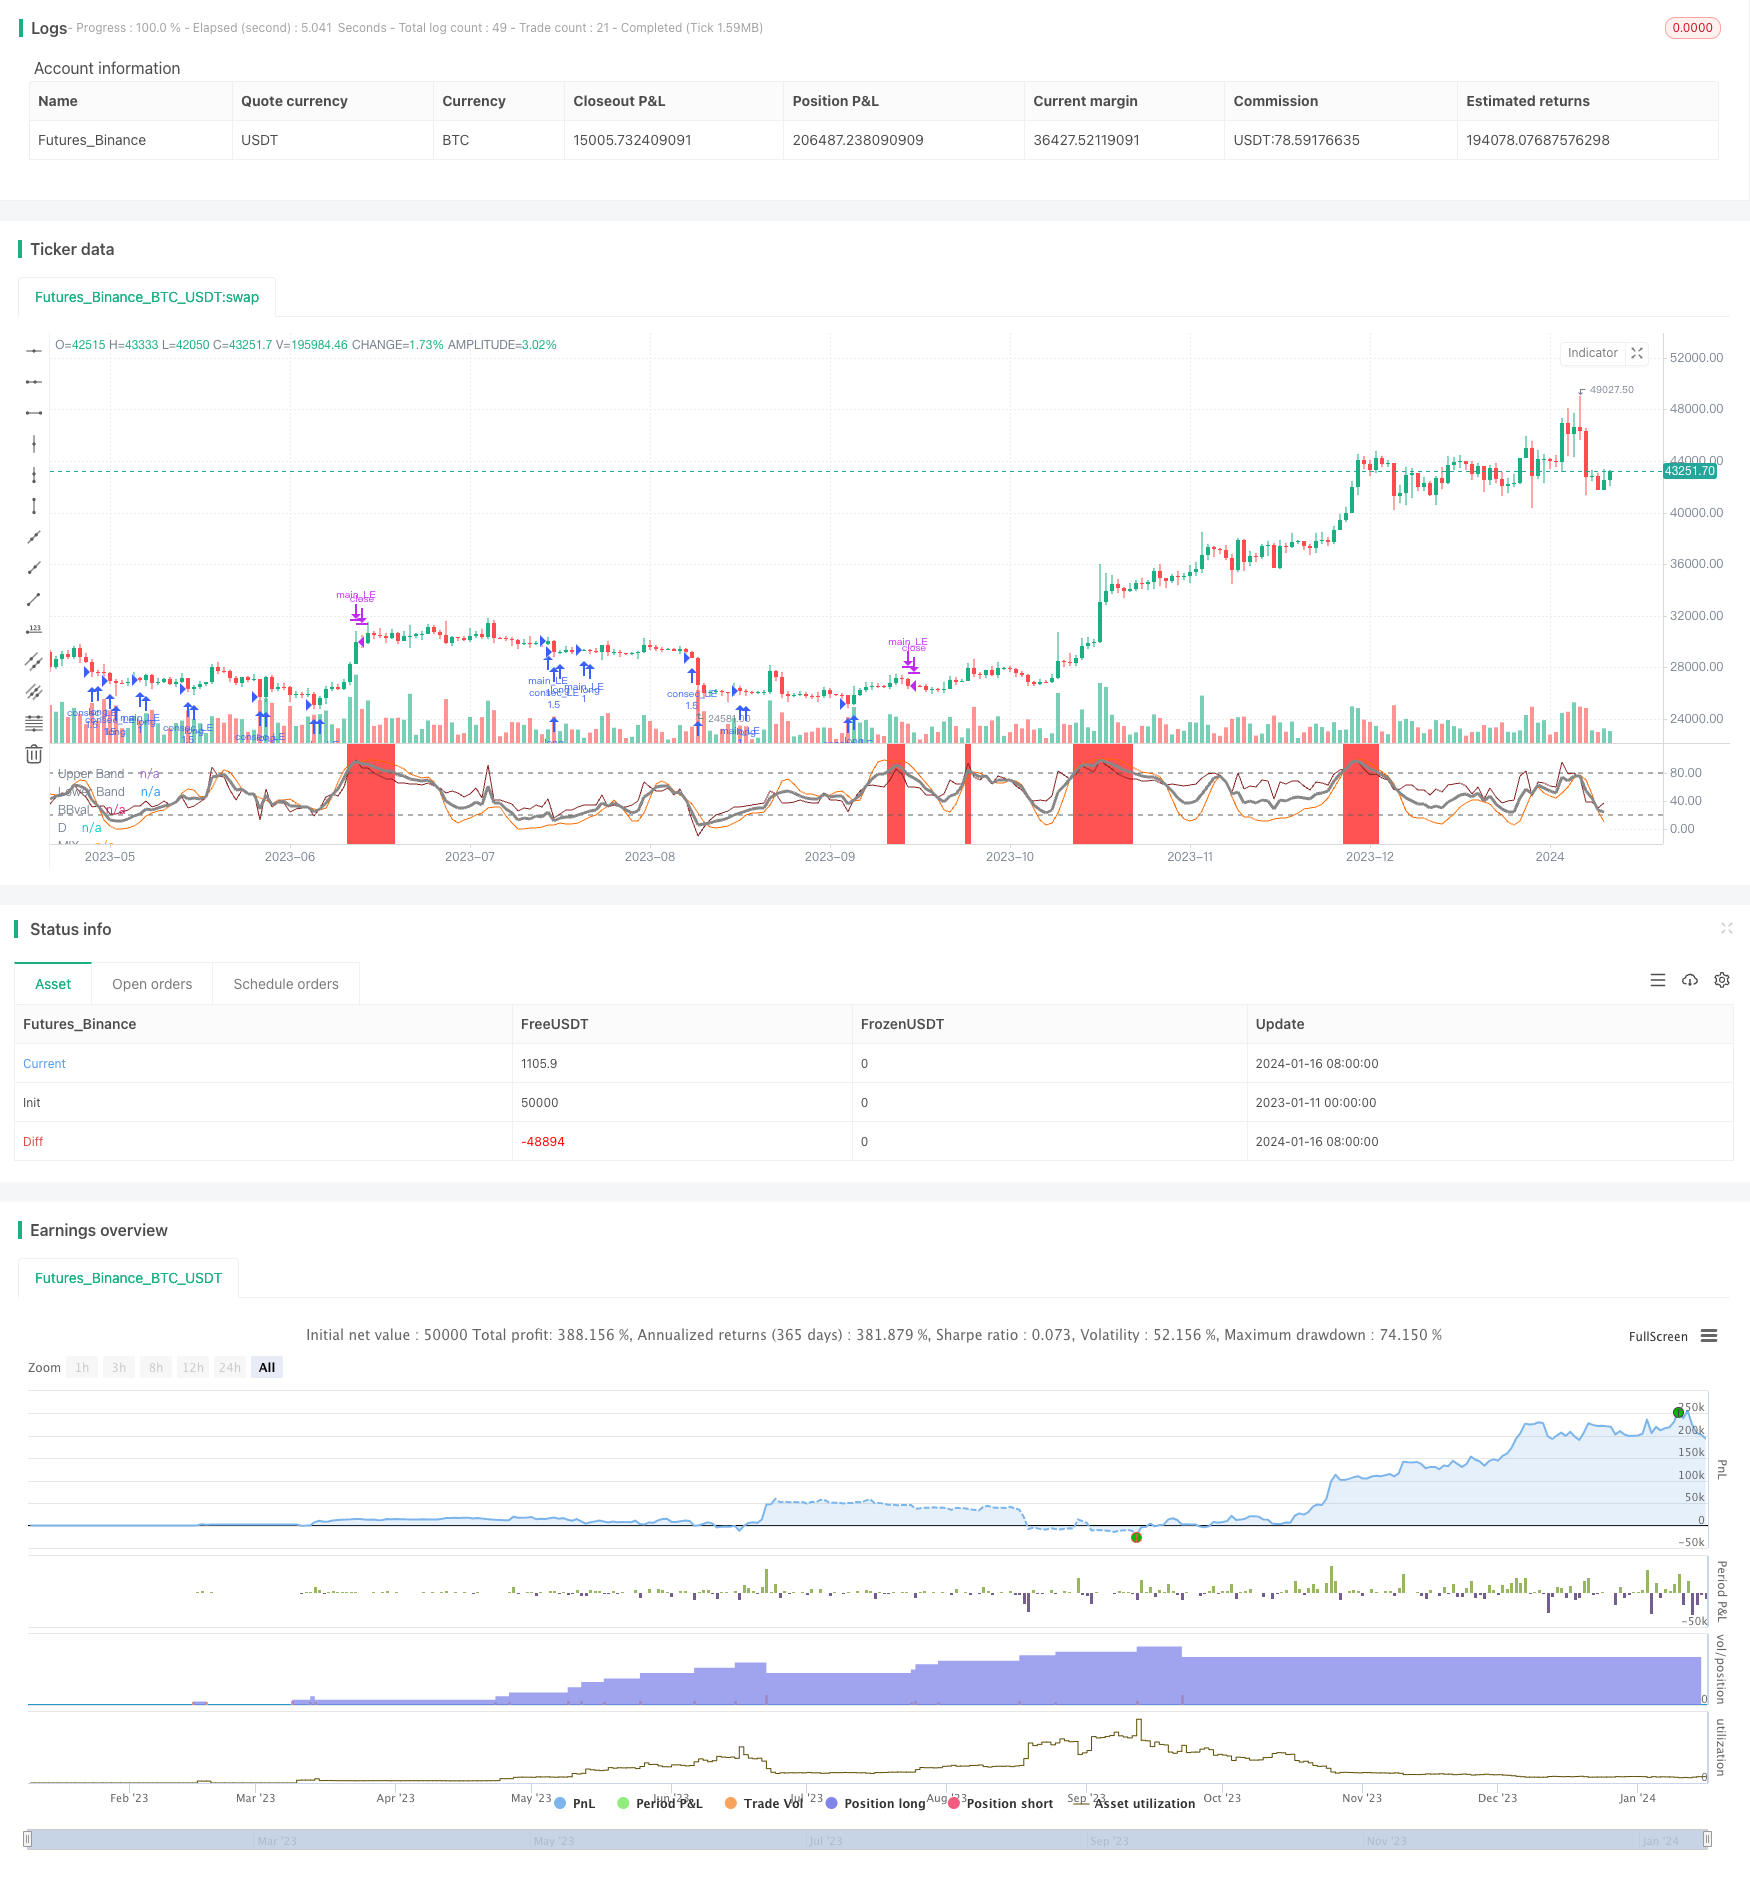
该策略名称为“双指标渐进DCA策略”。它基于布林通道和相对强度指数(RSI)这两个指标构建交易信号,同时利用渐进加仓的方法进行风险管理。其主要思想是在牛市中捕捉趋势,利用指标构建多头信号;而在跌势中利用渐进DCA策略降低成本。
该策略融合了布林通道和RSI两个指标。布林通道能清晰判断行情趋势,布林中轨上方为牛市,下方为熊市。RSI指标则判断超买超卖现象。策略构建了一个MIX指标,它将布林通道价差和RSI的K值进行加权平均。当MIX指标由下向上突破20时产生多头信号。
渐进DCA部分,首先在MIX指标突破20时打开首单。之后每次价格下跌一定幅度,就按一定金额追加仓位。直至达到最大持仓量或者止损止盈退出。这样可以在行情低点多次加仓,实现成本均价的下移。
-
双指标结合清晰判断趋势,增加信号准确性。
-
渐进DCA策略可以在跌势中降低仓位成本,减少亏损风险。同时增大盈利空间。
-
设定了止损和止盈条件,可以及时止损控制风险,也确保部分利润。
-
加入开仓日期范围参数,可以针对特定时间周期进行测试和优化。
-
布林通道和RSI指标均可能出现失效的情况。可以测试不同参数组合寻找最佳点位。
-
渐进DCA可能在大跌行情中持续追加仓位导致亏损放大。可以设定最大加仓次数,并适当提高止损线完善风险控制。
-
无法防止突发事件的异常行情。可加入大盘指标判断系统性风险,避开异常时期。
-
测试优化MIX指标的参数,以获得更精确的交易信号。
-
优化止损止盈的参数,实现盈亏比的最大化。
-
测试不同追加开仓的幅度和次数,寻找最佳组合。
-
可以考虑加入交易量控制模块,在特定交易量条件下打开或关闭策略。
“双指标渐进DCA策略”综合运用了多个量化技术指标与方法。它构建了清晰的趋势判断指标,并利用渐进加仓降低成本。同时,严格的止损止盈与风险控制手段使其可以安全实用。通过进一步测试与优化,该策略可以成为具备独特优势的量化交易方案。它既考虑获取足够盈利,也注重风险的控制,值得实盘验证与应用。
||
The strategy is named "Bollinger Band and RSI Mixing with DCA". It builds trading signals based on the Bollinger Band and Relative Strength Index (RSI) indicators and manages risks using progressive dollar cost averaging (DCA). The main idea is capturing the trend in a bull market using the indicators and reducing costs in a down market through progressive DCA.
The strategy integrates the Bollinger Band and RSI indicators. The Bollinger Band clearly judges the trend where above the middle band means a bull market and below means a bear market. RSI indicates overbuying and overselling situations. The strategy builds a MIX indicator by weighting the Bollinger band deviation and the K value of RSI. A long signal is generated when the MIX indicator breaks through 20 from below.
For the progressive DCA part, an initial position is opened when MIX breaks through 20. Additional positions are added at a fixed amount every time the price drops by a fixed percentage. This is continued until the maximal positions are reached or stop loss/take profit is triggered. By adding positions at market lows multiple times, the average cost can be lowered progressively.
-
Combining two indicators improves signal accuracy by a clearer trend judgment.
-
The progressive DCA lowers cost basis during declines, reducing loss risk while increasing profit range.
-
Take profit and stop loss conditions promptly control risks and lock in partial profit.
-
Added date range filter allows focused backtests and optimizations of specific periods.
-
Both Bollinger Band and RSI may suffer failures. Different parameter combinations can be tested for best signal accuracy.
-
Progressive DCA can increase loss during big crashes by continuously adding positions. Maximal entries can be set along with proper stop loss level for better risk control.
-
Black swan events and abnormal price moves cannot be foreseen. Systemic risk filters using major indices can help avoid anomalous periods.
-
Test and optimize parameters for the MIX indicator to obtain more accurate trading signals.
-
Optimize stop loss, take profit parameters for best profit/loss ratio.
-
Test different adding position sizes and frequencies to find optimal combinations.
-
Consider adding trading volume control modules to open/close strategy based on volume conditions.
The "Bollinger Band and RSI Mixing with DCA Strategy" combines multiple quantitative techniques and methods. It builds a clear trend judging indicator and lowers cost basis through progressive additions. Strict risk control methods including stop loss and take profit makes it practical. Further tests and optimizations can unlock its unique advantages into a profitable trading system. With both profit seeking and risk control in mind, it is worth verifying with live trading and applications.
[/trans]
Strategy Arguments
| Argument | Default | Description |
|---|---|---|
| v_input_1 | 3 | K |
| v_input_2 | 3 | D |
| v_input_3 | 14 | RSI Length |
| v_input_4 | 14 | Stochastic Length |
| v_input_5_close | 0 | RSI Source: close |
| v_input_6 | 20 | BB lookback length |
| v_input_7 | 2 | StdDev |
| v_input_8 | false | Offset |
| v_input_9 | true | From Month |
| v_input_10 | true | From Day |
| v_input_11 | 2020 | From Year |
| v_input_12 | true | To Month |
| v_input_13 | true | To Day |
| v_input_14 | 2112 | To Year |
| v_input_15 | true | Amount (P) |
| v_input_16 | 2 | % Price drop for consecutive entries(X) |
| v_input_17 | 10 | % Level for Take Profit (B) |
| v_input_18 | 10 | % Level for Stop Loss (D) |
| v_input_19 | 5 | Max consecutive entries (A) |
| v_input_20 | 0.5 | Z |
Source (PineScript)
/*backtest
start: 2023-01-11 00:00:00
end: 2024-01-17 00:00:00
period: 1d
basePeriod: 1h
exchanges: [{"eid":"Futures_Binance","currency":"BTC_USDT"}]
*/

// © lagobrian23
//@version=4
strategy(title = 'Bollinger Bands and RSI mix with DCA', shorttitle = 'BB/RSI with DCA',pyramiding = 20, calc_on_every_tick = true, overlay = false )
source=close
smoothK = input(3, "K", minval=1)
smoothD = input(3, "D", minval=1)
lengthRSI = input(14, "RSI Length", minval=1)
lengthStoch = input(14, "Stochastic Length", minval=1)
src = input(close, title="RSI Source")
rsi1 = rsi(src, lengthRSI)
k = sma(stoch(rsi1, rsi1, rsi1, lengthStoch), smoothK)
d = sma(k, smoothD)

// Bollinger Band

length = input(20,title = 'BB lookback length', minval=1)
mult = input(2.0, minval=0.001, maxval=50, title="StdDev")
basis = sma(src, length)
dev = mult * stdev(src, length)
upper = basis + dev
lower = basis - dev
BBval = (src - basis)/dev*30+50
offset = input(0, title = "Offset", type = input.integer, minval = -500, maxval = 500)
mix=(d + BBval)/2

//plot
//plot(k, "K", color=#606060)
plot(BBval, "BBval", color=#872323, offset = offset)
plot(d, "D", color=#FF6A00)
h0 = hline(80, "Upper Band", color=#606060)
h1 = hline(20, "Lower Band", color=#606060)
plot(mix, "MIX", color=#888888, linewidth=3)

//background MIX
bgcolor(mix < 20 ? color.green : color.white, transp=50)
bgcolor(mix > 80 ? color.red : color.white, transp=50)

// Choosing the date range
fromMonth = input(defval = 1,    title = "From Month",      type = input.integer, minval = 1, maxval = 12)
fromDay   = input(defval = 1,    title = "From Day",        type = input.integer, minval = 1, maxval = 31)
fromYear  = input(defval = 2020, title = "From Year",       type = input.integer, minval = 1970)
toMonth = input(defval = 1,    title = "To Month",      type = input.integer, minval = 1, maxval = 12)
toDay   = input(defval = 1,    title = "To Day",        type = input.integer, minval = 1, maxval = 31)
toYear  = input(defval = 2112, title = "To Year",       type = input.integer, minval = 1970)

start     = timestamp(fromYear, fromMonth, fromDay, 00, 00)        // backtest start window
finish    = timestamp(toYear, toMonth, toDay, 23, 59)        // backtest finish window
window()  => true

// Initializing the strategy paraeters

P = input(defval = 1, title = 'Amount (P)' , type = input.integer, minval = 1, maxval = 100)
X = input(defval = 2, title = '% Price drop for consecutive entries(X)', type = input.float, minval = 1, maxval = 100)
B_tp = input(defval = 10, title = '% Level for Take Profit (B)', type = input.float , minval = 1, maxval = 100)
D_sl = input(defval = 10, title = '% Level for Stop Loss (D)', type = input.float, minval = 1, maxval = 100)
A = input(defval = 5, title = 'Max consecutive entries (A)', type = input.integer, minval = 2, maxval = 20)
Z = input(defval = 0.5, title = 'Z', type = input.float , minval = 0, maxval = 10)

// Declaring key DCA variables
entry_price = 0.0
entry_price := na(entry_price[1]) ? na : entry_price[1]
new_entry = 0.0
consec_entryCondition = false
// Implementing the strategy
longEntry = crossover(mix,20)
exitLongs = crossunder(mix, 80)

if(longEntry)
    entry_price := close
    strategy.entry('main_LE', strategy.long , P, when = window() and longEntry)

// Exiting conditions
stoploss = strategy.position_avg_price*(1-(D_sl/100))
takeprofit = strategy.position_avg_price*(1+(B_tp/100))
slCondition = crossunder(close, stoploss)
tpCondition = crossover(close, takeprofit)

// We want to exit if the 'mix' indicator crosses 80, take profit is attained or stop loss is tagged.
exitConditions = exitLongs or slCondition or tpCondition

// Consecutive entries upto A times
// strategy.risk.max_intraday_filled_orders(A)

//Dollar-Cost-Averaging
// Enter long whenever price goes down X%: amount set to (P+Y)*Z
newAmount = (P+X)*Z
// If we haven't reached max open trades, buy newAmount immediately price crosses under X% lower the previous entry price
new_entry := entry_price - ((X/100)*entry_price)
consec_entryCondition := crossunder(close, new_entry)
if(consec_entryCondition and strategy.opentrades != A)
    strategy.entry('consec_LE', strategy.long, newAmount, oca_name = 'consecLongs', when = window() and consec_entryCondition)
    entry_price := close

// Exiting
// The main trade is closed only when the  main exit conditions are satisfied
strategy.close('main_LE', comment = 'Main Long Closed', when = window() and exitConditions)

// A consective long is closed only when tp or sl is tagged
strategy.exit('ext a consec', 'consec_LE', loss = D_sl*strategy.position_avg_price , profit = B_tp*strategy.position_avg_price, oca_name =  'consecLongs')
Detail
https://www.fmz.com/strategy/439186
Last Modified
2024-01-18 11:23:15