Name
玻尔兰德波带跟踪策略Bollinger-Band-Tracking-Strategy
Author
ChaoZhang
Strategy Description
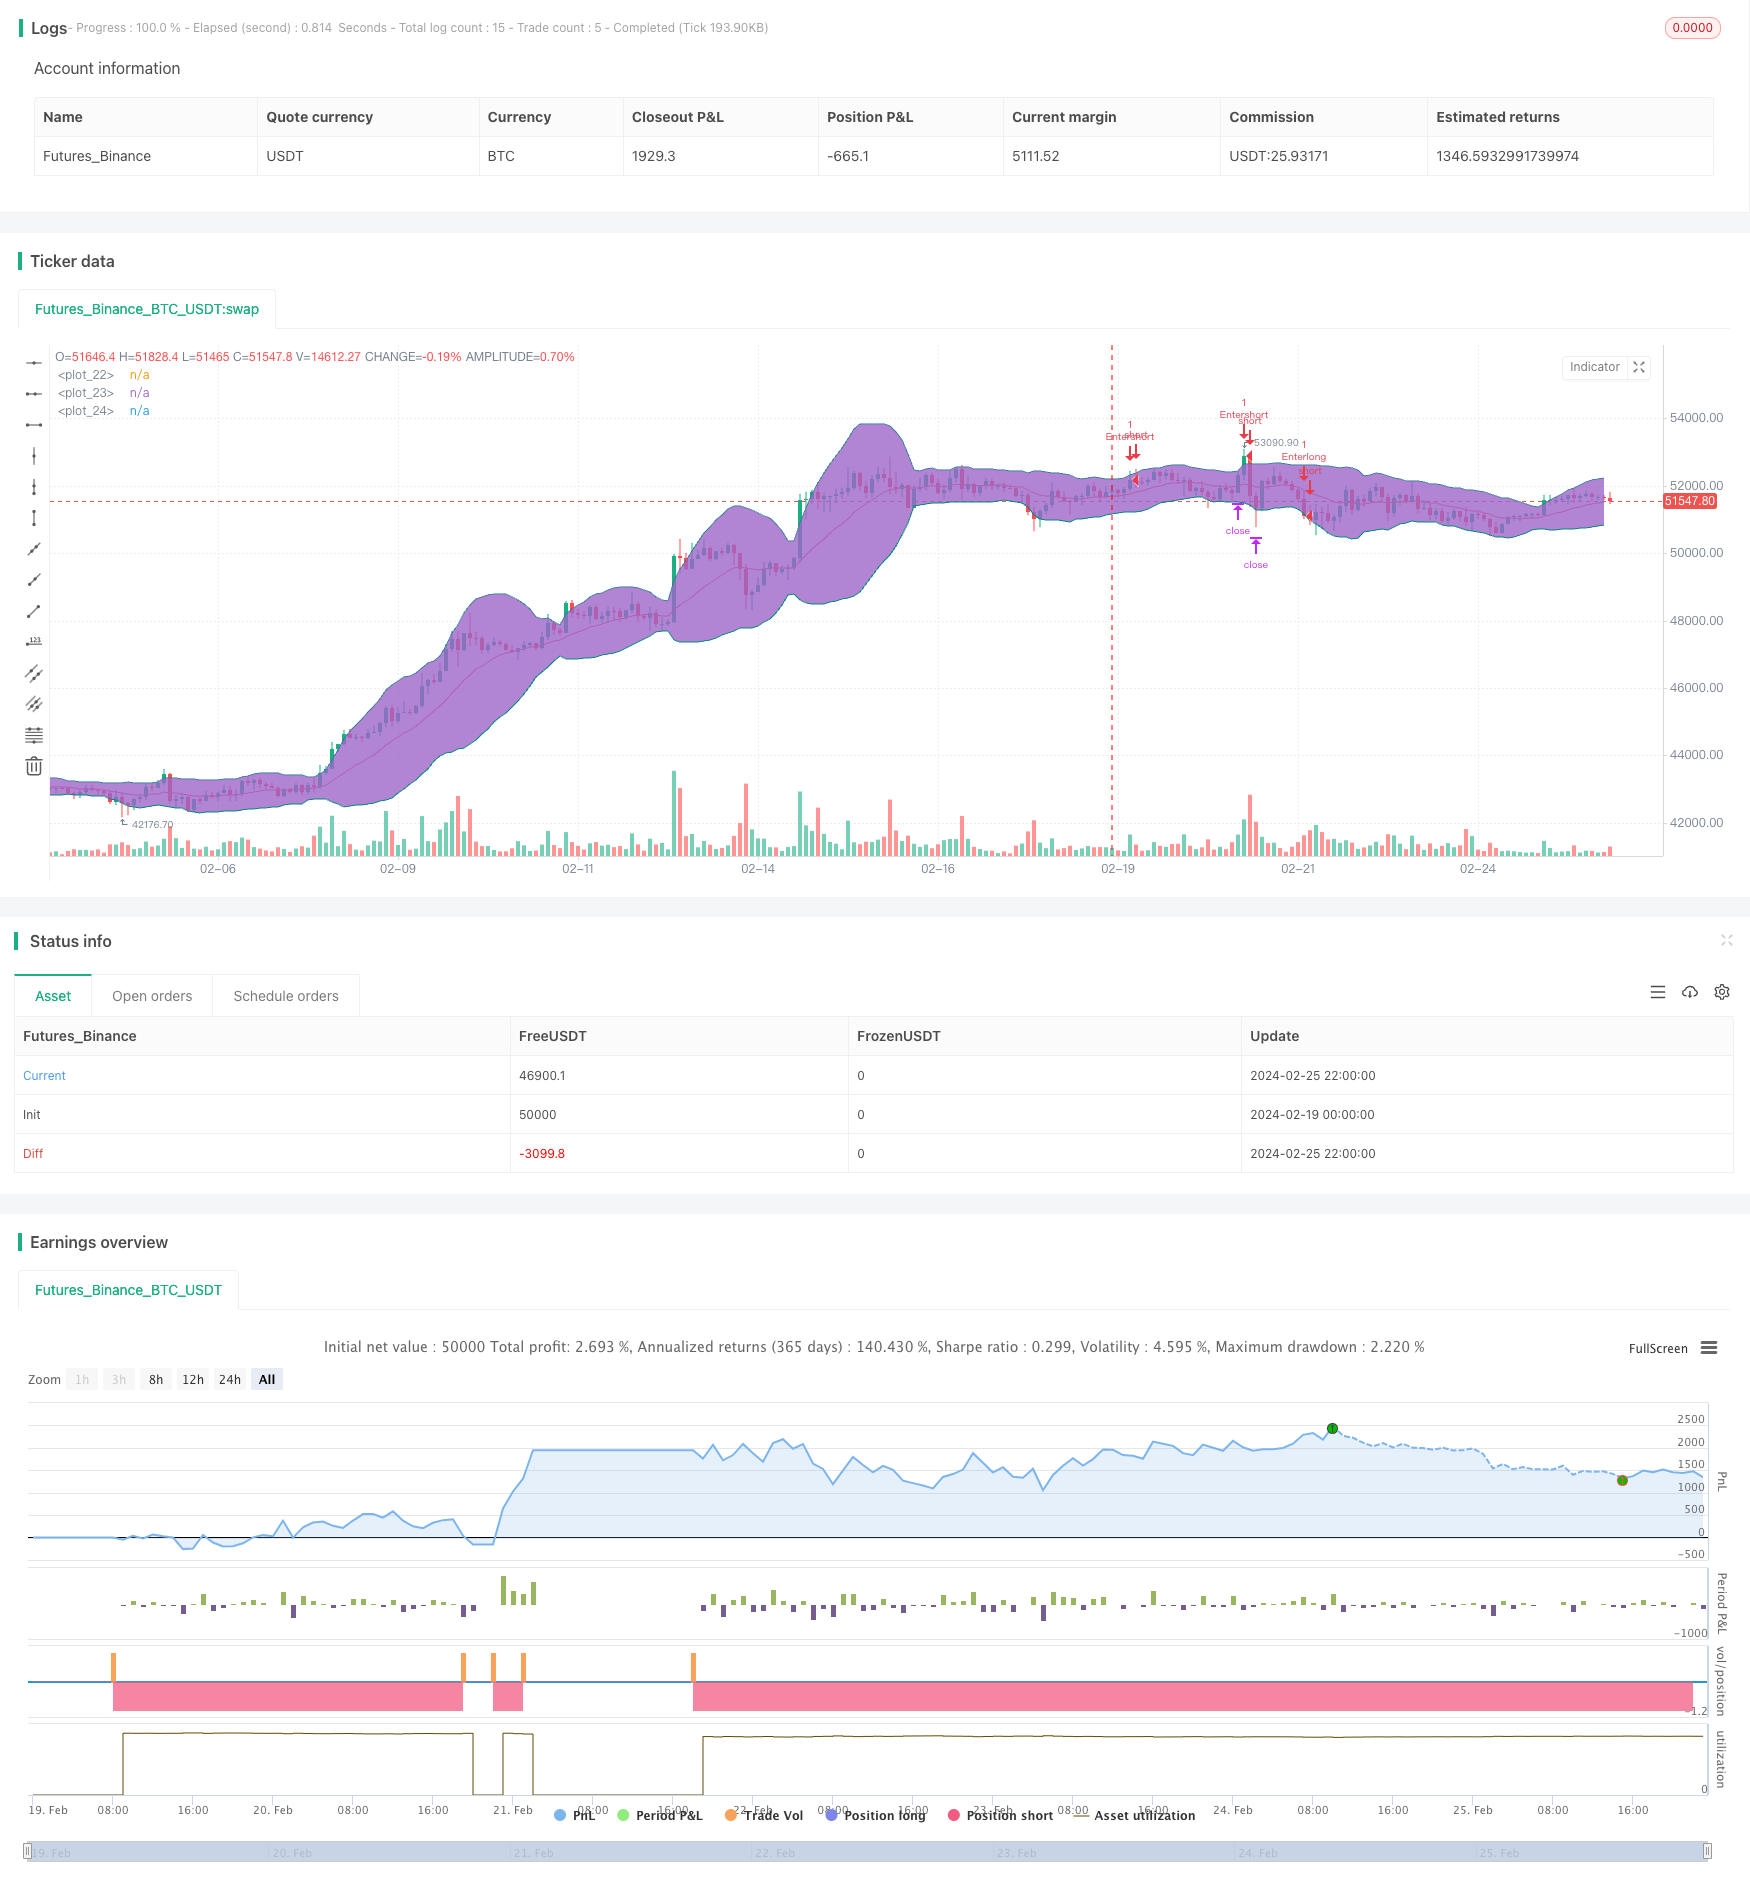
此策略运用玻尔兰德波带指标,结合跟踪止损,实现趋势跟踪交易。当价格突破上轨时做空,当价格跌破下轨时做多,设置止损和止盈价格,以锁定收益。同时,该策略还提供可选的反转入场选择,即当价格重新进入波带时反向做单。
该策略首先计算布林带的中轨、上轨和下轨。中轨为长度为Len的WMA均线,上轨和下轨距离代表标准差的倍数Deviation。
当价格上穿上轨线时,做空;当价格下穿下轨线时,做多。开仓后设置止损和止盈价格。止损价格为输入的Stop值,止盈价格为输入的Limit值。
此外,策略还提供反转开仓的选择。勾选“Reversal Entry”后,价格重新进入布林带时做反向单,属于MEAN REVERSION交易方式。
无论顺势开仓还是反转开仓,止损和止盈设置都相同。止损和止盈均有两个选择,固定止损或移动止损。后者trailers stop会根据价格变化进行调整。
该策略结合布林带指标和跟踪止损,能够有效控制风险,同时锁定趋势获利。反转开仓方式可以减少止损被触发的概率。
布林带上下轨能清晰判断价格突破,波段交易方式使盈亏结果明朗。跟踪止损调整止损位置,防止获利被套。
布林带策略最大的风险在于趋势反转。突破上轨做空后,价格可能出现V型反转,导致快速止损。做多情况也类似。
反转开仓方式可能错过趋势延续机会。价格重新进入波带后做反向单,可能使利润减少。
此外,参数设置不当也会导致风险放大。Len和Deviation需要谨慎设置,否则将增加止损风险。
该策略可以从以下几个方面进行优化:
-
增加参数自适应功能。Len和Deviation可以根据市场波动程度进行动态调整,使布林带更贴近价格。
-
增加开仓过滤条件。可以添加交易量突增、成交笔数增加等额外条件,避免被套。
-
结合其他指标过滤信号。比如MACD,KDJ等指标判断趋势性,避免错漏信号。
-
增加时间限制。只在特定时间段交易,可以减少隔夜风险。
该玻尔兰德波带跟踪策略,使用布林带指标判断价格突破。设置止盈止损锁定收益,运用跟踪止损调整风险。策略简单实用,可根据市场选择顺势或反转交易。通过参数优化和条件过滤,可以将风险进一步降低,从而获得更稳定的收益。
||
This strategy uses the Bollinger Band indicator combined with tracking stop loss to implement trend tracking trading. It goes short when the price breaks through the upper rail and goes long when the price breaks through the lower rail. By setting stop loss and take profit prices, profits can be locked. Meanwhile, this strategy also provides an optional reversal entry selection, which means making reverse orders when the price re-enters the band.
The strategy first calculates the middle rail, upper rail and lower rail of the Bollinger Band. The middle rail is the WMA with the length of Len, and the upper and lower rails represent the standard deviation multiplied by Deviation.
When the price breaks through the upper rail, go short; when the price breaks through the lower rail, go long. After opening position, set stop loss and take profit price. The stop loss price is the input Stop value, and take profit price is the input Limit value.
In addition, the strategy also provides the option for reversal opening. When “Reversal Entry” is checked, reverse orders will be made when the price re-enters the Bollinger Band, which belongs to MEAN REVERSION trading.
Whether it’s trend opening or reversal opening, the settings for stop loss and take profit are the same. There are two options for stop loss and take profit - fixed stop loss or trailing stop which will be adjusted according to price change.
The strategy combines Bollinger Band indicator and tracking stop loss to effectively control risks while locking in trend profits. Reversal opening could reduce the probability of stop loss being triggered.
Bollinger Band upper and lower rails can clearly determine price breakthroughs. The banded trading method makes PnL results clear. Tracking stop loss adjusts stop loss position to prevent earned profits from being pulled back.
The biggest risk of Bollinger Band strategy is trend reversal. After going short when price breaks through upper rail, price may appear V-shaped reversal, leading to quick stop loss. The long position faces similar situation.
Reversal opening may miss opportunities for trend continuation. Making reverse orders when price re-enters the band may reduce profits.
In addition, improper parameter settings may also amplify risks. Len and Deviation need to be set cautiously, otherwise the risk of stop loss would increase.
The strategy can be optimized in the following aspects:
-
Add parameter adaptive functionality. Len and Deviation can be dynamically adjusted according to market volatility to make Bollinger Band closer to price.
-
Add opening position filters. Additional conditions can be added such as trading volume surges and increase of trading transactions to avoid being pulled back.
-
Combine with other indicators’ filter signals. Judge trend tendency using indicators like MACD and KDJ to avoid wrong signals or missing signals.
-
Add time restrictions. Only trading during certain period of time can reduce overnight risks.
The Bollinger Band tracking strategy determines price breakthroughs using Bollinger Band indicator. It locks profits by settings stop loss and take profit, and uses tracking stop loss to adjust risks. The strategy is simple and practical. Based on market conditions, trend trading or reversal trading can be selected. By optimizing parameters and adding filter conditions, risks could be further reduced to obtain more steady profits.
[/trans]
Strategy Arguments
| Argument | Default | Description |
|---|---|---|
| v_input_1 | 20 | Length |
| v_input_2_close | 0 | Source: close |
| v_input_3 | 2 | Deviation |
| v_input_4 | true | Trailing Stop(checked), Market stop(unchecked) |
| v_input_5 | 10000 | Stop (in ticks) |
| v_input_6 | 20000 | Limit Out |
| v_input_7 | true | Reversal Entry(checked, Trend Entry(unchecked) |
| v_input_8 | false | Limit Time of Day (Buying Side) |
| v_input_9 | 1600-0500 | Start/Stop trades (Est time) |
Source (PineScript)
/*backtest
start: 2024-02-19 00:00:00
end: 2024-02-26 00:00:00
period: 2h
basePeriod: 15m
exchanges: [{"eid":"Futures_Binance","currency":"BTC_USDT"}]
*/

//@version=4
strategy(title="BB Strategy (Basic)",overlay=true, initial_capital=25000, default_qty_value=1, commission_type=strategy.commission.cash_per_contract, commission_value=3.02)
len = input(20, minval=1, title="Length")
src = input(close, title="Source")
mult = input(2.0, "Deviation", minval=0.001, maxval=50)
//price_drop = input(.003, "When price drops (In Ticks) Enter Long", step=.001)
//price_climb = input(.003, "When price climbs (In Ticks) Enter Short", step=.001)
trail = input(true, "Trailing Stop(checked), Market stop(unchecked)")
stop = input(10000, "Stop (in ticks)", step=5)
limit = input(20000, "Limit Out", step=5)
//size = input(1, "Limit Position Size (pyramiding)", minval=1)
revt = input(true, "Reversal Entry(checked, Trend Entry(unchecked)")
timec = input(false, "Limit Time of Day (Buying Side)")

//calculations and plots
revti = if revt==false
    true
basis = wma(src, len)
dev = mult * stdev(src, len)
upper = basis + dev
lower = basis - dev
plot(basis, color=red)
p1 = plot(upper, color=teal)
p2 = plot(lower, color=teal)
fill(p1, p2)
u = crossover(high, upper)
d = crossunder(low, lower)
//Time Session
sess = input("1600-0500", "Start/Stop trades (Est time)")
t = time(timeframe.period, sess)

//Orders
if(timec)
    strategy.entry("Enterlong", long=revt, when=d and t>1)
else
    strategy.entry("Enterlong", long=revt, when=d)
if(trail)
    strategy.exit("Exit","Enterlong", profit=limit, trail_points = 0, trail_offset = stop )
else
    strategy.exit("Exit","Enterlong", profit=limit, loss = stop )

if(timec)
    strategy.entry("Entershort", long=revti, when=u and t>1)
else
    strategy.entry("Entershort", long=revti, when=u)
if(trail)
    strategy.exit("Exit","Entershort", profit=limit, trail_points = 0, trail_offset = stop )
else
    strategy.exit("Exit","Entershort", profit=limit, loss = stop )
Detail
https://www.fmz.com/strategy/442955
Last Modified
2024-02-27 16:11:44