Name
移动均线趋势跟踪优化策略Quant-Lights-Moving-Average-Trend-Tracking-Optimization-Strategy
Author
ChaoZhang
Strategy Description
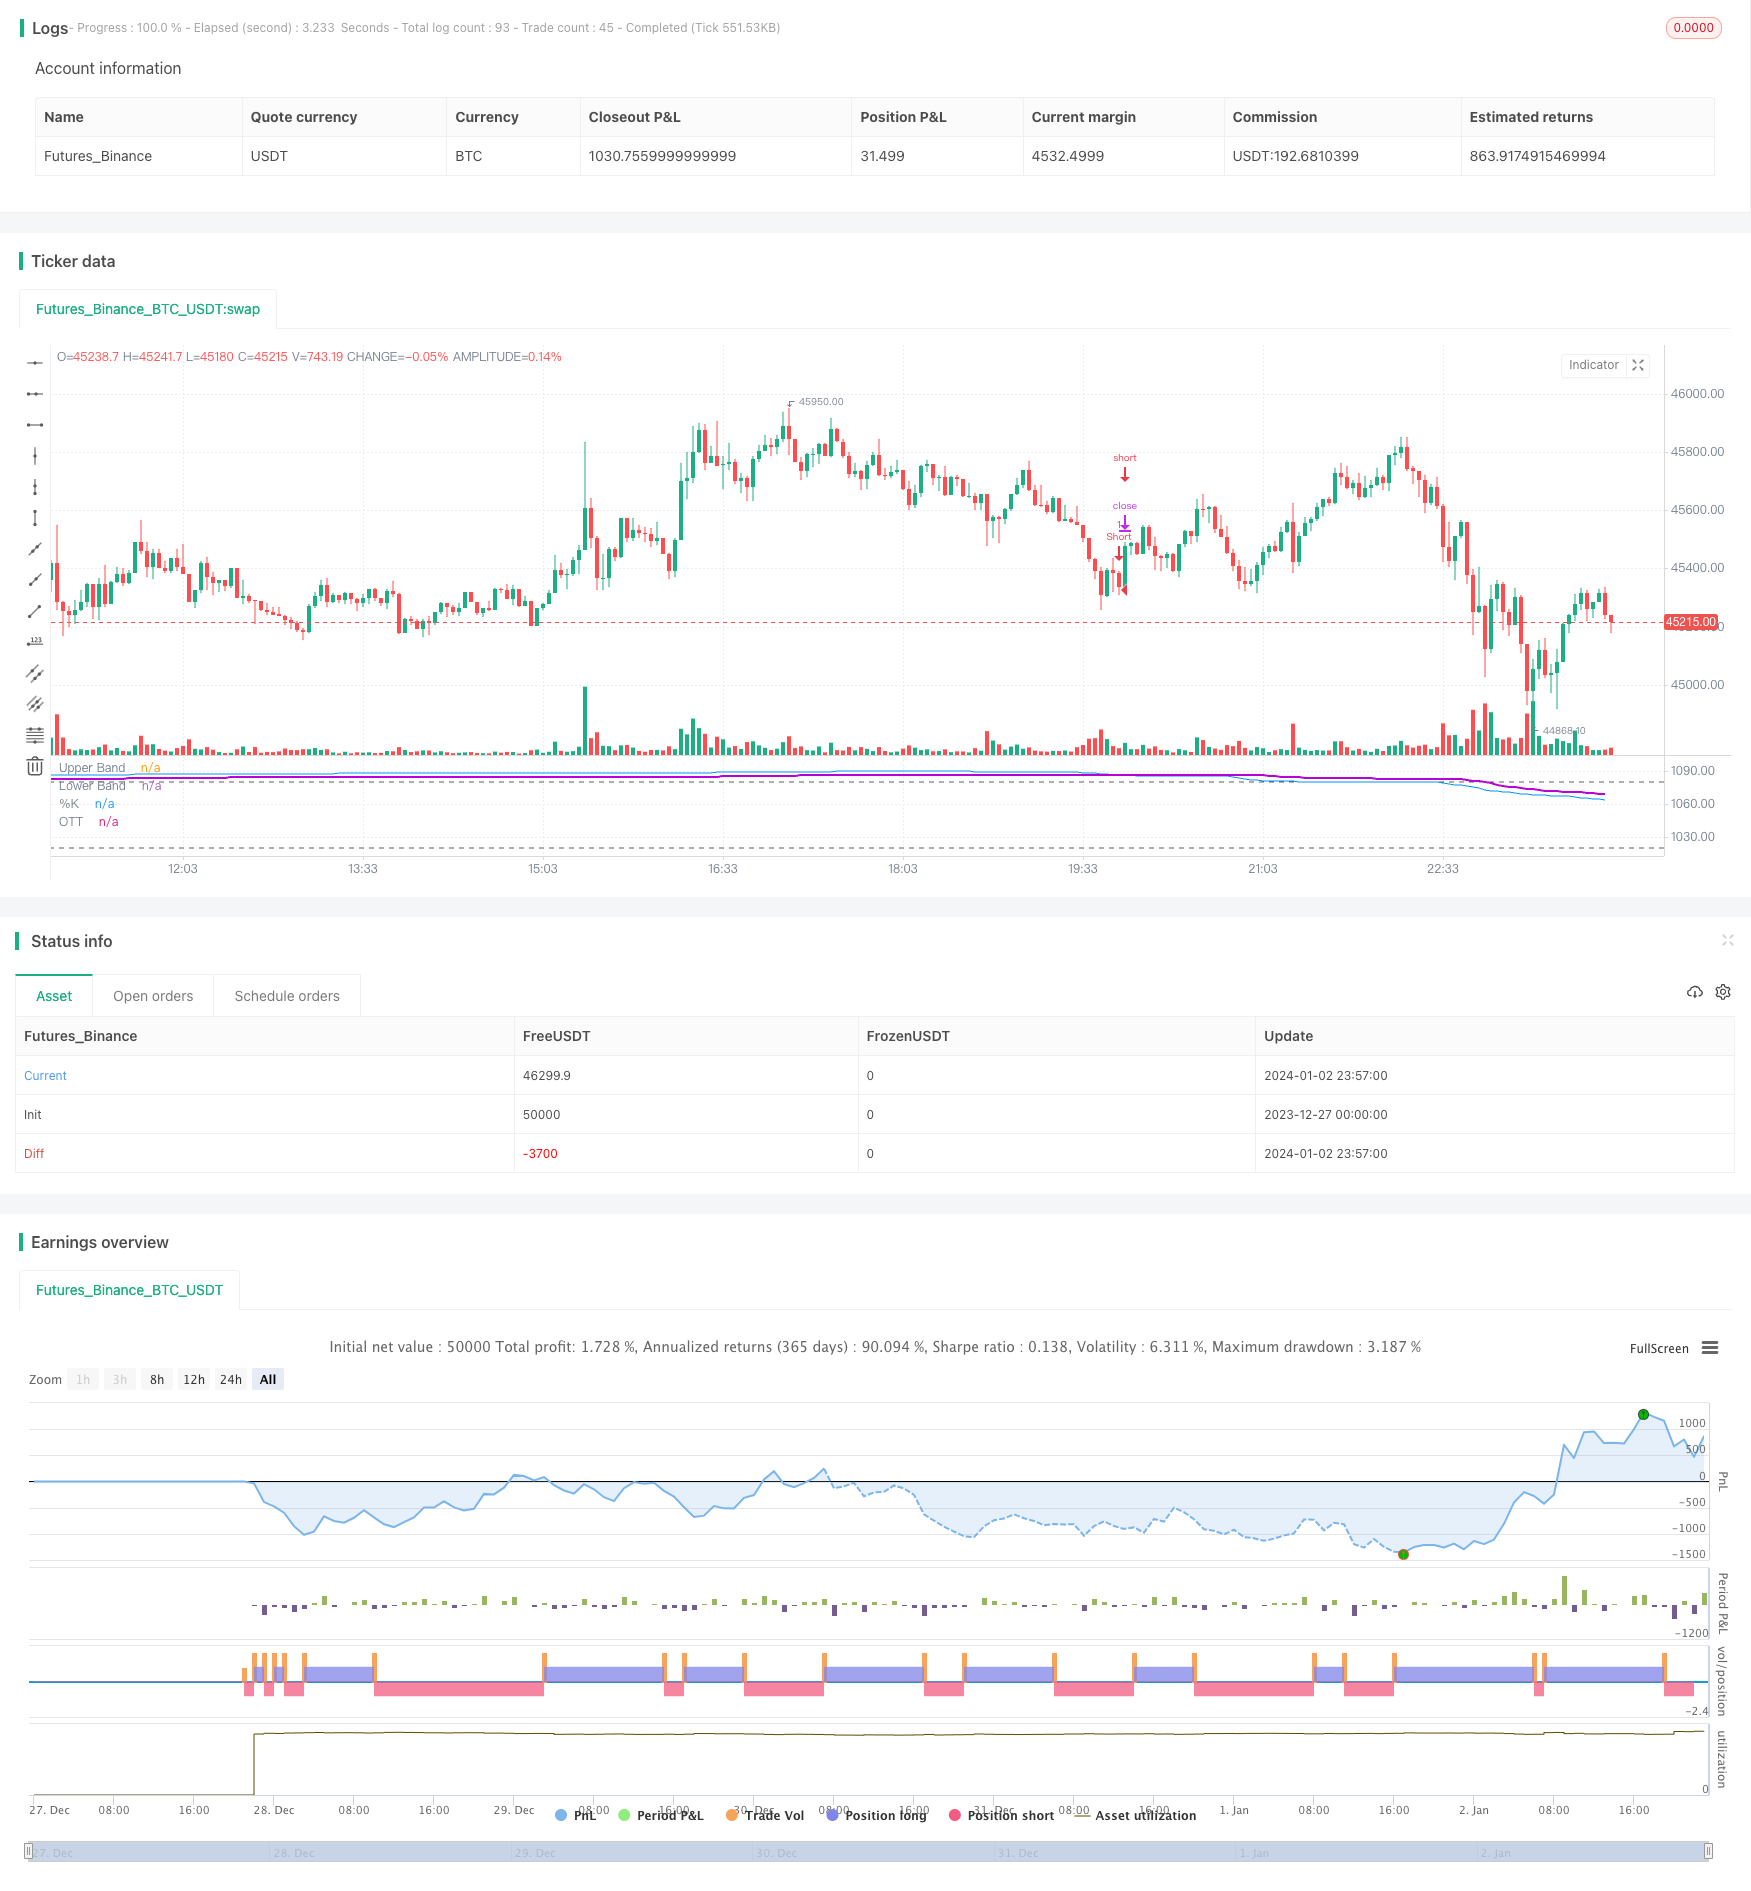
【量化之光】这是一个采用Stochastic指标和OTT指标的组合策略。策略利用Stochastic指标产生买入和卖出信号,并结合OTT指标对信号进行过滤,试图抓住大趋势并且减少行情震荡造成的虚假信号的影响。本文将对该策略进行详细评估。
该策略的核心思想是在Stochastic指标上叠加OTT指标进行信号过滤。Stochastic指标将价格与指定时间段内的最高价和最低价进行比较,用于判断价格是否处于极端区域。OTT指标采用移动平均线和动态止损来跟踪趋势。
代码设置Stochastic的高位为1080,低位为1020,Stochastic中值在此之间时为持平区间。在Stochastic生成买入/卖出信号时,代码将根据OTT指标判断信号有效性。如果价格向上穿越OTT平均线的话,则发出买入信号,如果价格向下穿越OTT平均线的话,则发出卖出信号。
这种组合利用Stochastic判断超买超卖并发出入场信号,OTT负责追踪趋势,利用止损过滤掉太强的震荡行情造成的虚假信号,从而优化了信号的准确率和波动率。
该策略利用Stochastic和OTT指标的组合,优化了以下几个方面:
- 提高了信号的准确率。Stochastic判断超买超卖,OTT负责滤除震荡行情造成的虚假信号。
- 降低了策略的波动率。通过动态止损限制了本次亏损,过滤很多假突破。
- 有效地抓住股票大趋势。Stochastic给出基本信号,OTT跟踪大趋势。
- 减少了过多的信号干扰。提高信号质量的同时也减少了无用信号。
- 计量化动态止损设定。定性保障本次亏损,进一步降低策略波动率。
- 系统结合趋势和超买超卖指标。利用这2种指标互相优化缺点。
综合来看,该策略通过运用OTT对Stochastic信号进行过滤,有效提高了信号质量和策略收益,同时降低了交易次数和策略波动率,达到了贴近趋势、低风险高收益的效果。
- 本策略适用范围相对较窄。主要应用于有明显趋势的股票。对于价格波动很大的股票,或者股价处于震荡整理的股票影响较小。
- 完全依赖技术面。策略没有考虑股票的基本面和市场的宏观面,存在一定的盲目性。
- 参数设置敏感。Stochastic和OTT的多个参数需要专业调校,否则会影响策略的盈利能力。
- 止损过于宽松。承担一定的潜在损失,需要进一步优化。
- 假突破和震荡行情下会产生一定的亏损和信号干扰。需要修改判断条件和止损条件。
针对上述风险,可采取以下措施进行改进:
- 根据不同类别股票使用不同参数组合。
- 结合基本面和新闻面发出信号增强。
- 对参数进行优化测试寻找最优设置。
- 引入移动止损以进一步降低风险。
- 修改判断条件,采用更加严谨的信号确认机制。
该策略可以在以下几个方面进行深化优化:
-
根据不同市场和股票类别调整参数设定。现在的默认值是通用的,可以对不同股票分别测试寻找最优参数组合。
-
引入止盈机制和移动止损。现在采用的是动态的固定止损,无法动态跟踪亏损和收益。可以测试引入移动止损和止盈来进一步控制策略风险收益。
-
优化信号判断逻辑。现在的判断逻辑较为简单,对价格的上下突破直接标记买入和卖出信号。可以考虑结合更多指标和价格形态判断来确保信号的可靠性。
-
增加开仓条件和过滤机制。现在的策略对每一个信号进行无差别处理。可以引入量能指标、成交量指标等开仓条件,并增加一定的信号时间窗口来滤除假信号。
-
测试不同的指标与OTT的结合。现在采用的是Stochastic与OTT的组合。可以测试MACD、RSI等其他指标与OTT的结合效果。
-
融合资金管理和仓位管理模块。现在没有资金管理和仓位控制机制,完全依赖止损。可以测试不同类型的资金管理和仓位管理方法来进一步控制单笔和总体风险。
【量化之光】这是一个Stochastic与OTT指标有机结合的量化策略。它利用两种指标互补优势,提高了信号准确率,有效抓住大趋势的同时也降低了风险。
该策略具有误差率低、信号清晰、波动率小的优点。它增强了信号的可靠性,优化了止损水平,降低了交易频率,是一款值得推荐的量化策略。
与此同时,本策略也存在一定的改进空间。通过参数优化、止损机制完善、信号和过滤机制增强等手段,可以使该策略向更稳定、自动化和智能化的方向发展,这也是我们后续的工作目标。
||
Quant Lights is a combined strategy using the Stochastic indicator and the OTT indicator. The strategy uses the Stochastic indicator to generate buy and sell signals, and combines them with the OTT indicator to filter the signals, trying to catch the big trend and reduce the impact of market fluctuations that cause false signals. This article will evaluate the strategy in detail.
The core idea of the strategy is to superimpose the OTT indicator on the Stochastic indicator for signal filtering. The Stochastic indicator compares the price with the highest and lowest prices in the specified time period to judge whether the price is in an extreme area. The OTT indicator uses moving averages and dynamic stops to track trends.
The code sets the high level of Stochastic at 1080 and the low level at 1020. When the Stochastic value is between them, it is a range-bound area. When Stochastic generates buy/sell signals, the code will determine the validity of the signal based on the OTT indicator. If the price crosses above the OTT average line, a buy signal is issued. If the price crosses below the OTT average line, a sell signal is issued.
This combination takes advantage of Stochastic to determine overbought and oversold conditions and generate entry signals, while OTT is responsible for tracking trends and using stops to filter out false signals caused by excessive market fluctuations, thereby optimizing signal accuracy and volatility.
The strategy combines Stochastic and OTT indicators to optimize the following aspects:
- Improved signal accuracy. Stochastic judges overbought and oversold conditions, OTT filters out false signals caused by fluctuating markets.
- Reduced strategy volatility. Limits the current loss through dynamic stops, filtering out many false breakouts.
- Effectively captures major stock trends. Stochastic provides basic signals and OTT tracks major trends.
- Reduces excessive signal interference. Improves signal quality while reducing useless signals.
- Quantifies dynamic stop settings. Qualitatively guarantees the current loss and further reduces strategy volatility.
- System integrates trend and overbought/oversold indicators. Use these 2 types of indicators to optimize each other's weaknesses.
In summary, by using OTT to filter Stochastic signals, the strategy effectively improves signal quality and investment returns, while reducing the number of transactions and strategy volatility, achieving the effect of low risk, high returns and close tracking of trends.
- The scope of application of this strategy is relatively narrow. It is mainly suitable for stocks with obvious trends. It has less impact on stocks with very large price fluctuations or stocks in sideways consolidation.
- Completely relies on technical analysis. The strategy does not consider the fundamentals of the stocks and the macro environment, so there is some blind spot.
- Sensitive parameter settings. Multiple parameters of Stochastic and OTT need professional tuning, otherwise it will affect the profitability of the strategy.
- Stops are too loose. Bearing some potential losses that need further optimization.
- There will be certain losses and signal interference during false breakouts and fluctuating markets. Judgement conditions and stop conditions need to be modified.
Regarding the above risks, the following measures can be taken to improve:
- Use different parameter combinations for different types of stocks.
- Enhance signals by incorporating fundamentals and news.
- Optimize parameters through testing to find the optimal settings.
- Introduce moving stops to further reduce risks.
- Modify judgement conditions and use more rigorous signal confirmation mechanisms.
The strategy can be further optimized in the following aspects:
-
Adjust parameter settings according to different markets and types of stocks. The current default values are universal and can be tested separately for different stocks to find the optimal parameter combinations.
-
Introduce take profit and moving stop mechanisms. Currently using dynamic fixed stops is unable to dynamically track losses and gains. Testing the introduction of moving stops and take profits for further risk and profit control can be conducted.
-
Optimize signal judgement logic. The current judgment logic is relatively simple, directly marking buy and sell signals when prices break up or down. More indicators and price patterns can be incorporated to ensure signal reliability.
-
Increase open position conditions and filtering mechanisms. The current strategy processes every signal indiscriminately. Volume indicators, trading volume indicators and other open position conditions can be introduced, as well as a certain signal time window to filter out false signals.
-
Test different indicator combinations with OTT. Currently using the Stochastic and OTT combination. Effectiveness of combining other indicators such as MACD and RSI with OTT can be tested.
-
Integrate capital management and position sizing modules. Currently there are no capital management and position control mechanisms, relying entirely on stops. Different types of capital management and position sizing methods can be tested to further control single and overall risks.
Quant Lights is a quantitative strategy that organically combines the Stochastic indicator with the OTT indicator. It utilizes the complementary strengths of the two indicators to improve signal accuracy and effectively capture major trends while reducing risks.
The advantages of the strategy include low error rate, clear signals, and small volatility. It enhances signal reliability, optimizes stop levels, reduces trading frequency, and is a recommended quantitative strategy.
At the same time, there is still room for improvement in this strategy. Through parameter optimization, improvement of the stop mechanism, enhancement of signals and filtering mechanisms, etc., the strategy can develop towards a more stable, automated and intelligent direction. This is also the goal of our follow-up work.
[/trans]
Strategy Arguments
| Argument | Default | Description |
|---|---|---|
| v_input_1 | 250 | %K Length |
| v_input_2 | 50 | %K Smoothing |
| v_input_3_close | 0 | Source: close |
| v_input_4 | 3 | OTT Period |
| v_input_5 | 0.618 | OTT Percent |
| v_input_6 | false | Show Support Line? |
| v_input_7 | false | Show Stochastic/OTT Crossing Signals? |
| v_input_8 | true | =Backtest Inputs= |
| v_input_9 | true | From Day |
| v_input_10 | true | From Month |
| v_input_11 | 2005 | From Year |
| v_input_12 | true | To Day |
| v_input_13 | true | To Month |
| v_input_14 | 9999 | To Year |
Source (PineScript)
/*backtest
start: 2023-12-27 00:00:00
end: 2024-01-03 00:00:00
period: 3m
basePeriod: 1m
exchanges: [{"eid":"Futures_Binance","currency":"BTC_USDT"}]
*/

//@version=4
// This source code is subject to the terms of the Mozilla Public License 2.0 at https://mozilla.org/MPL/2.0/
// © KivancOzbilgic
//created by: @Anil_Ozeksi
//developer: ANIL ÖZEKŞİ
//author: @kivancozbilgic


strategy(title="Stochastic Optimized Trend Tracker", shorttitle="SOTT", format=format.price, precision=2)
periodK = input(250, title="%K Length", minval=1)
smoothK = input(50, title="%K Smoothing", minval=1)
src1 = input(close, title="Source")
length=input(3, "OTT Period", minval=1)
percent=input(0.618, "OTT Percent", type=input.float, step=0.1, minval=0)
showsupport = input(title="Show Support Line?", type=input.bool, defval=false)
showsignalsc = input(title="Show Stochastic/OTT Crossing Signals?", type=input.bool, defval=false)
Var_Func1(src1,length)=>
    valpha1=2/(length+1)
    vud11=src1>src1[1] ? src1-src1[1] : 0
    vdd11=src1<src1[1] ? src1[1]-src1 : 0
    vUD1=sum(vud11,9)
    vDD1=sum(vdd11,9)
    vCMO1=nz((vUD1-vDD1)/(vUD1+vDD1))
    VAR1=0.0
    VAR1:=nz(valpha1*abs(vCMO1)*src1)+(1-valpha1*abs(vCMO1))*nz(VAR1[1])
VAR1=Var_Func1(src1,length)
k = Var_Func1(stoch(close, high, low, periodK), smoothK)
src=k+1000
Var_Func(src,length)=>
    valpha=2/(length+1)
    vud1=src>src[1] ? src-src[1] : 0
    vdd1=src<src[1] ? src[1]-src : 0
    vUD=sum(vud1,9)
    vDD=sum(vdd1,9)
    vCMO=nz((vUD-vDD)/(vUD+vDD))
    VAR=0.0
    VAR:=nz(valpha*abs(vCMO)*src)+(1-valpha*abs(vCMO))*nz(VAR[1])
VAR=Var_Func(src,length)
h0 = hline(1080, "Upper Band", color=#606060)
h1 = hline(1020, "Lower Band", color=#606060)
fill(h0, h1, color=#9915FF, transp=80, title="Background")
plot(k+1000, title="%K", color=#0094FF)
MAvg=Var_Func(src, length)
fark=MAvg*percent*0.01
longStop = MAvg - fark
longStopPrev = nz(longStop[1], longStop)
longStop := MAvg > longStopPrev ? max(longStop, longStopPrev) : longStop
shortStop =  MAvg + fark
shortStopPrev = nz(shortStop[1], shortStop)
shortStop := MAvg < shortStopPrev ? min(shortStop, shortStopPrev) : shortStop
dir = 1
dir := nz(dir[1], dir)
dir := dir == -1 and MAvg > shortStopPrev ? 1 : dir == 1 and MAvg < longStopPrev ? -1 : dir
MT = dir==1 ? longStop: shortStop
OTT=MAvg>MT ? MT*(200+percent)/200 : MT*(200-percent)/200
plot(showsupport ? MAvg : na, color=#0585E1, linewidth=2, title="Support Line")
OTTC = #B800D9
pALL=plot(nz(OTT[2]), color=OTTC, linewidth=2, title="OTT", transp=0)
alertcondition(cross(src, OTT[2]), title="Price Cross Alert", message="OTT - Price Crossing!")
alertcondition(crossover(src, OTT[2]), title="Price Crossover Alarm", message="PRICE OVER OTT - BUY SIGNAL!")
alertcondition(crossunder(src, OTT[2]), title="Price Crossunder Alarm", message="PRICE UNDER OTT - SELL SIGNAL!")
buySignalc = crossover(src, OTT[2])
plotshape(buySignalc and showsignalsc ? OTT*0.995 : na, title="Buy", text="Buy", location=location.absolute, style=shape.labelup, size=size.tiny, color=color.green, textcolor=color.white, transp=0)
sellSignallc = crossunder(src, OTT[2])
plotshape(sellSignallc and showsignalsc ? OTT*1.005 : na, title="Sell", text="Sell", location=location.absolute, style=shape.labeldown, size=size.tiny, color=color.red, textcolor=color.white, transp=0)

dummy0 = input(true, title = "=Backtest Inputs=")
FromDay    = input(defval = 1, title = "From Day", minval = 1, maxval = 31)
FromMonth  = input(defval = 1, title = "From Month", minval = 1, maxval = 12)
FromYear   = input(defval = 2005, title = "From Year", minval = 2005)
ToDay      = input(defval = 1, title = "To Day", minval = 1, maxval = 31)
ToMonth    = input(defval = 1, title = "To Month", minval = 1, maxval = 12)
ToYear     = input(defval = 9999, title = "To Year", minval = 2006)
Start     = timestamp(FromYear, FromMonth, FromDay, 00, 00)
Finish    = timestamp(ToYear, ToMonth, ToDay, 23, 59)
Timerange() =>
    time >= Start and time <= Finish ? true : false
if buySignalc
    strategy.entry("Long", strategy.long,when=Timerange())
if sellSignallc
    strategy.entry("Short", strategy.short,when=Timerange())
Detail
https://www.fmz.com/strategy/437656
Last Modified
2024-01-04 15:44:23