Name
移動的Vegas通道穿越策略Moving-Vegas-Channel-Crossover-Strategy
Author
ChaoZhang
Strategy Description
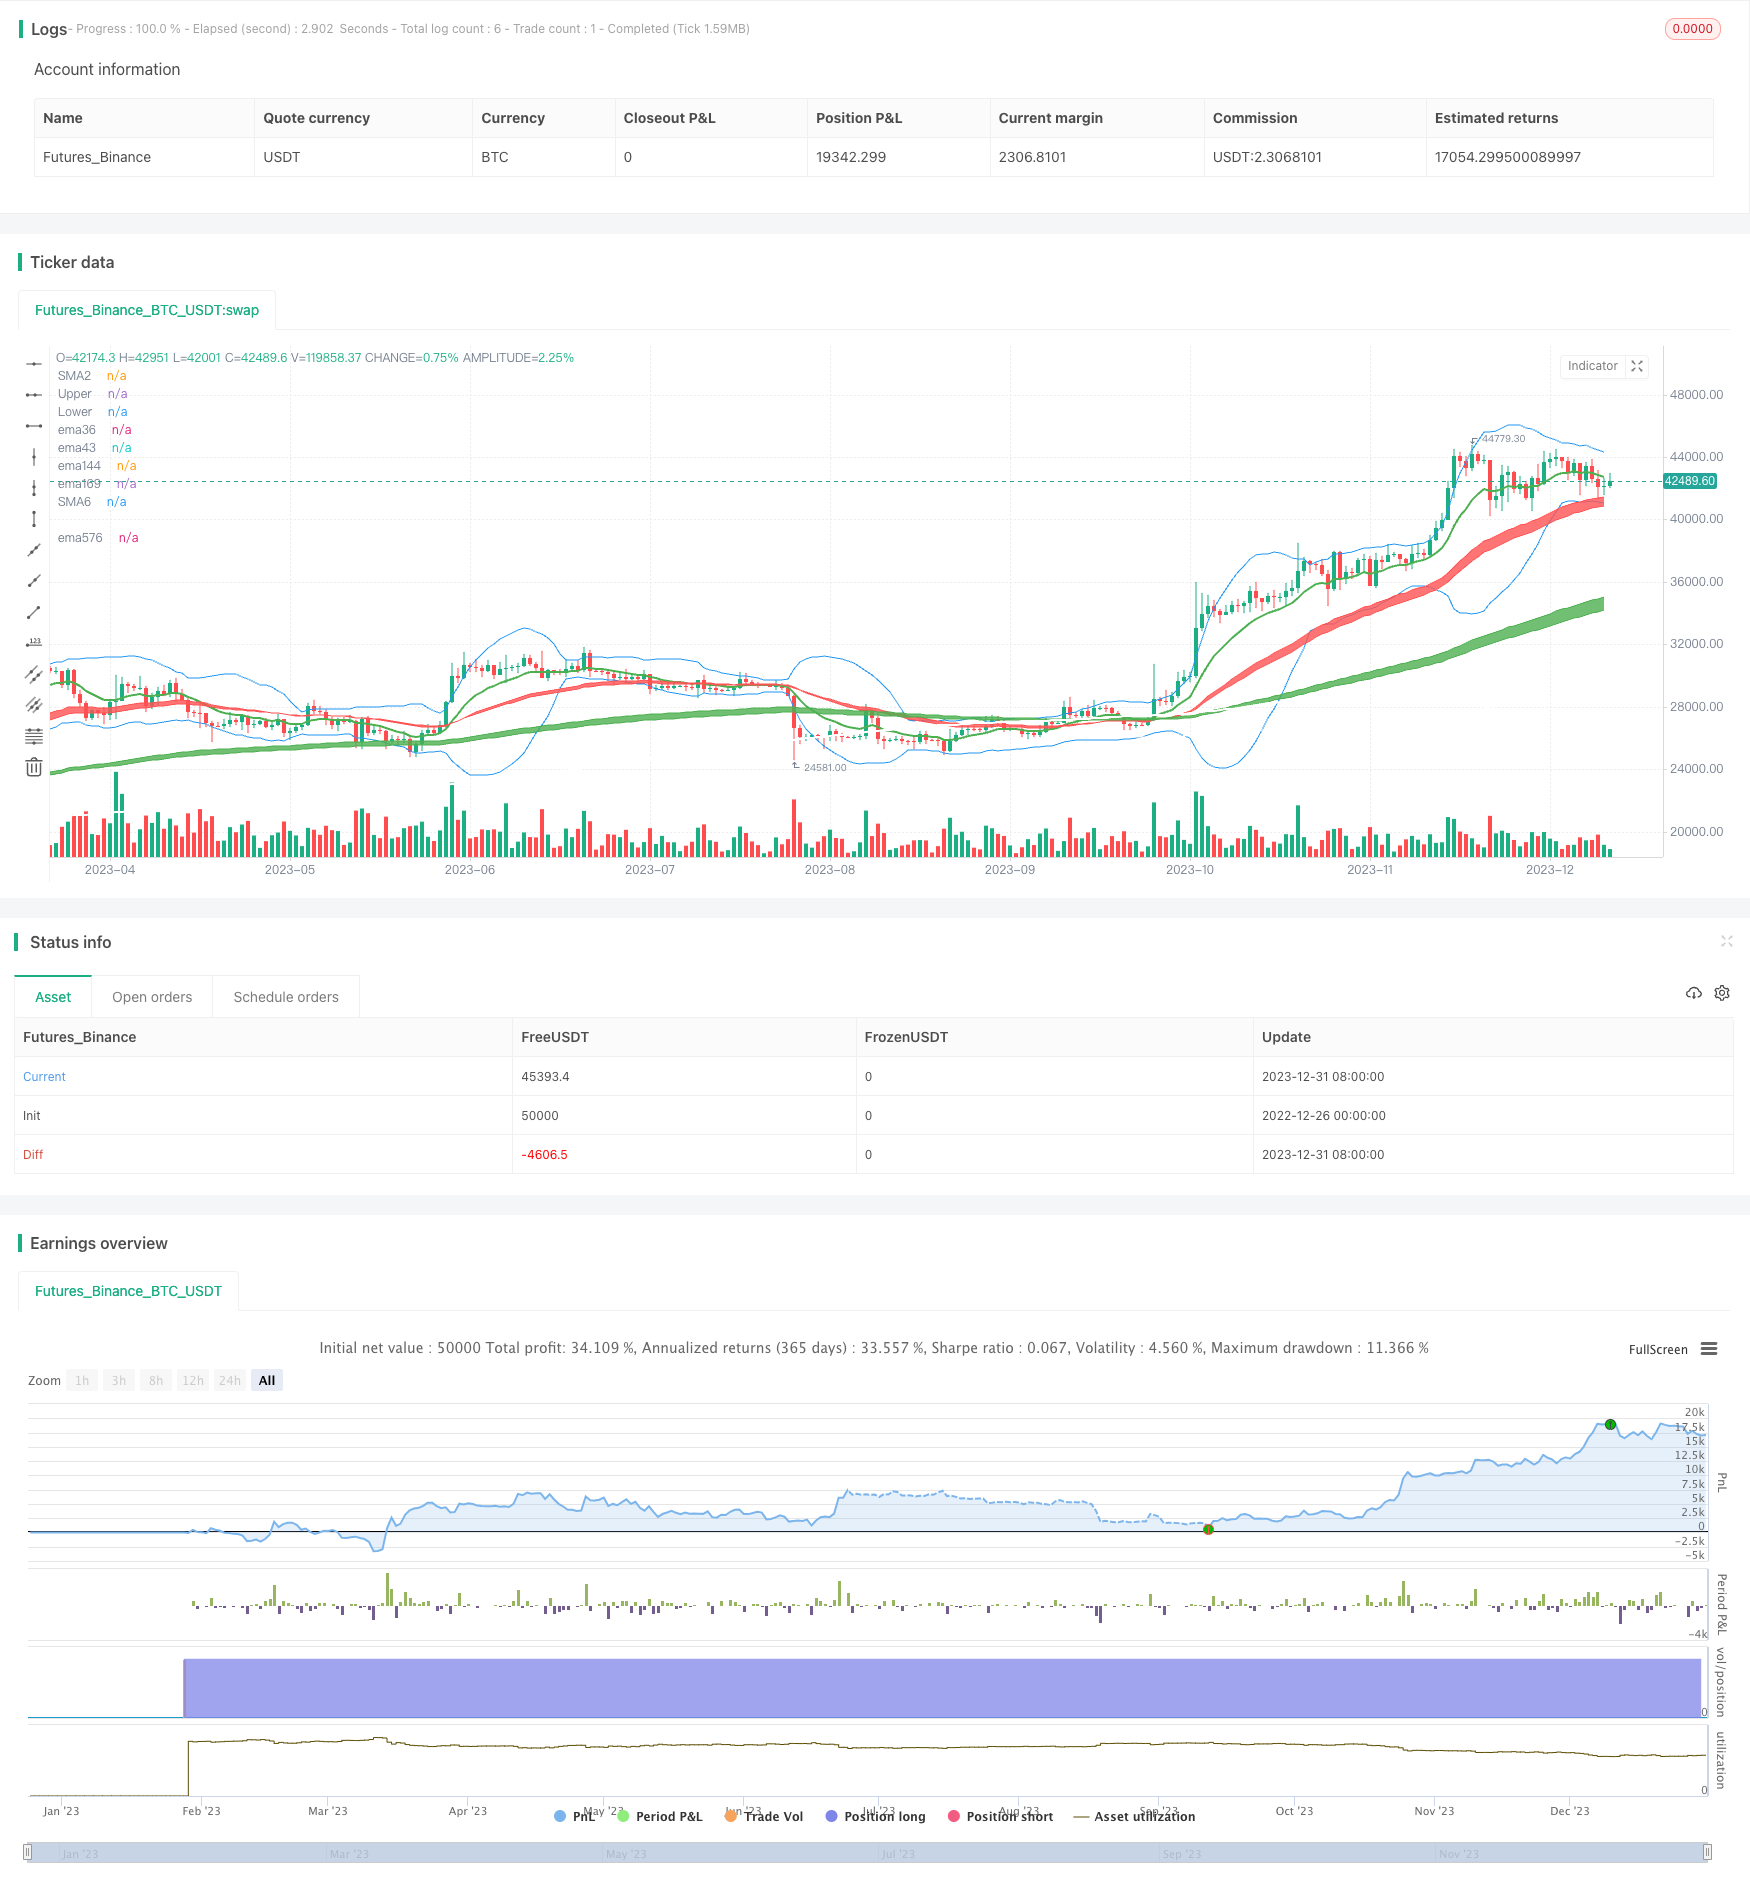
该策略的核心思想是根据EMA 36,143,169等不同周期的均线来判断股票的短中长期趋势方向,结合MACD指标来发出买卖信号。具体来说,短期以5、10日EMA判断,中期以20、60日EMA判断,长期以120、250日EMA判断,当短期EMA上穿中期EMA时看多,下穿看空;结合MACD的多空指标判断买卖时机。
Vegas隧道策略的具体原理:
- 使用EMA36和EMA43构成短期趋势判断,它们组成红色通道;
- 使用EMA144和EMA169构成中期趋势判断,它们组成绿色通道;
- 使用EMA576和EMA676构成长期趋势判断,它们组成灰色通道;
- 当价格站上各条EMA均线时就可以做多,再结合MACD指标向上突破0轴发出买入信号;
- 当价格跌破各条EMA均线时就可以做空,再结合MACD指标向下突破0轴发出卖出信号。
- 根据穿越的EMA均线周期分为短中长三个交易策略,分别对应不同的持仓周期。
该策略的优势主要体现在:
- 同时结合短、中、长三条通道判断趋势方向,比较稳定。
- Vegas隧道清晰直观,容易判断趋势。
- 结合MACD指标能够把握较好的买卖时机。
- 分短中长三个策略,可以更加灵活的进行操作。
该策略的主要风险:
- 股价剧烈波动时,EMA均线生成滞后,判断错误的可能性大。
- 三条通道判断不一致时,存在错误操作的风险。
- 分时图操作需要较强的心理承受能力。
应对方法:
- 可适当调整EMA均线周期,使其更加匹配目前市场特征。
- 交易前调整持仓比例,控制单笔损失。
该策略的优化空间:
- Vegas隧道区分趋势判断不够,可引入布林通道辅助判断。
- MACD指标对于区间震荡行情效果不佳,可改用KD、RSI等指标。
- 增加止损策略,如收盘价跌破关键EMA时主动止损。
- A股涨跌停影响大,可考虑对冲做空ETF。
||
The core idea of this strategy is to determine the short, mid and long term trend direction of stocks based on EMAs with different cycles such as 36, 143, 169, combined with MACD indicator to issue buying and selling signals. Specifically, in short term, 5 and 10 day EMAs are used to judge, in mid term, 20 and 60 day EMAs are used to judge, in long term, 120 and 250 day EMAs are used to judge, when short term EMA crosses middle term EMA upwards, it’s bullish, otherwise it’s bearish; MACD indicator of bullish and bearish signals is used to determine buying and selling time.
The specific mechanism of the Vegas Tunnel strategy:
- Use EMA 36 and EMA 43 to form short term trend judgment, they make up the red channel;
- Use EMA 144 and EMA 169 to form medium-term trend judgment, they make up the green channel;
- Use EMA576 and EMA676 to form long term trend judgment, they make up the gray channel;
- When the price stands on the above EMA lines, go long, combined with MACD indicator breaking through 0 axis upwards as buying signal;
- When the price breaks below the above EMA lines, go short, combined with MACD indicator breaking through 0 axis downwards as selling signal;
- According to the EMA line breakthrough, three strategies are defined, short, medium and long term respectively, corresponding to different holding period.
Advantages of this strategy:
- Combining short, medium and long three channels to judge trend direction, relatively stable;
- Vegas tunnel is intuitive to determine trend;
- MACD helps capture better buying and selling timing;
- Divided into short, medium and long three strategies for more flexible operations.
Major risks:
- When prices fluctuate wildly, EMA lines lag, likely to make wrong judgments;
- When three channels show inconsistent signals, risks of wrong operations exist;
- Minute chart operations need stronger psychological endurance.
Coping methods:
- Adjust EMA cycle to better match current market characteristics;
- Adjust position size beforehand to limit single loss.
Optimization space:
- Vegas tunnels’ trend judgement capability needs improving, Bollinger bands may be added;
- MACD works poorly for sideways markets, indicators like KD and RSI may be better options;
- Add stop loss policies, like stop loss when closing price breaks key EMA lines;
- Short ETF to hedge given A share limit-ups and downs having greater impacts.
[/trans]
Strategy Arguments
| Argument | Default | Description |
|---|---|---|
| v_input_1 | true | Use Current Chart Resolution? |
| v_input_2 | D | Use Different Timeframe? Uncheck Box Above |
| v_input_3 | 12 | 12 EMA |
| v_input_4 | 240 | 240 SMA |
| v_input_5 | 20 | BB Length |
| v_input_6_close | 0 | BB Source: close |
| v_input_7 | 2 | BB StdDev |
| v_input_8 | false | BB Offset |
| v_input_9 | true | Start Date |
| v_input_10 | true | Start Month |
| v_input_11 | 2018 | Start Year |
| v_input_12 | true | End Date |
| v_input_13 | 11 | End Month |
| v_input_14 | 2030 | End Year |
Source (PineScript)
/*backtest
start: 2022-12-26 00:00:00
end: 2024-01-01 00:00:00
period: 1d
basePeriod: 1h
exchanges: [{"eid":"Futures_Binance","currency":"BTC_USDT"}]
*/

//@version=4

strategy("Vegas Tunnel strategy", overlay=true)
//-------------------------------------------
//-------------------------------------------
// Inputs
useCurrentRes = input(true, title="Use Current Chart Resolution?")
resCustom = input(title="Use Different Timeframe? Uncheck Box Above", type=input.resolution, defval="D")
//tfSet = input(title = "Time Frame", options=["Current","120", "240", "D", "W"], defval="D")
tfSet = useCurrentRes ? timeframe.period : resCustom
maPeriods2 = input(12, "12 EMA")
maPeriods6 = input(240, "240 SMA")
BBlength = input(20, title="BB Length", minval=1)
BBsrc = input(close, title="BB Source")
mult = input(2.0, minval=0.001, maxval=50, title="BB StdDev")
sm2 = security(syminfo.tickerid, tfSet, ema(close, maPeriods2))
sm6 = security(syminfo.tickerid, tfSet, sma(close, maPeriods6))
p2 = plot(sm2, color=color.green, transp=30,  linewidth=2, title="SMA2")
p6 = plot(sm6, color=color.white, transp=30,  linewidth=2, title="SMA6")
//BB
basis = sma(BBsrc, BBlength)
dev = mult * stdev(BBsrc, BBlength)
upper = basis + dev
lower = basis - dev
offset = input(0, "BB Offset", type = input.integer, minval = -500, maxval = 500)
//plot(basis, "Basis", color=color.blue,linewidth, offset = offset)
pBB1 = plot(upper, "Upper", color=color.blue, offset = offset)
pBB2= plot(lower, "Lower", color=color.blue, offset = offset)

//MACD
fast_ma = ema(close, 48)
slow_ma = ema(close, 56)
macd = fast_ma - slow_ma

//vagas隧道
f1=ema(close, 36)
f2=ema(close, 43)
f3=ema(close, 144)
f4=ema(close, 169)
f5=ema(close, 576)
f6=ema(close, 676)
f7=ema(close,2304)
z1=plot(f1,color=color.red, title="ema36",transp=100)
z2=plot(f2,color=color.red, title="ema43",transp=100)
z3=plot(f3,color=color.green, title="ema144",transp=100)
z4=plot(f4,color=color.green, title="ema169",transp=100)
z5=plot(f5,color=color.white, title="ema576",transp=100)
z6=plot(f6,color=color.white, title="ema676",transp=100)
fill(z1, z2, color=color.red,transp=60)
fill(z3, z4, color=color.green,transp=60)
fill(z5, z6, color=color.gray,transp=60)

// Make input options that configure backtest date range
startDate = input(title="Start Date", type=input.integer,
     defval=1, minval=1, maxval=31)
startMonth = input(title="Start Month", type=input.integer,
     defval=1, minval=1, maxval=12)
startYear = input(title="Start Year", type=input.integer,
     defval=2018, minval=1800, maxval=2100)
endDate = input(title="End Date", type=input.integer,
     defval=1, minval=1, maxval=31)
endMonth = input(title="End Month", type=input.integer,
     defval=11, minval=1, maxval=12)
endYear = input(title="End Year", type=input.integer,
     defval=2030, minval=1800, maxval=2100)
// Look if the close time of the current bar
// falls inside the date range
inDateRange =  true

//波段多
if (inDateRange and crossunder(f3,f1))//
    strategy.entry("buy", strategy.long,1, when=macd>0, comment = "買Long-term")
buyclose=crossunder(f3,f5)
strategy.close("buy", when = buyclose, comment = "關Long-term")
//多策略1
if (inDateRange and crossover(low , f3) and macd>0 and f3>f6)
    strategy.entry("buy1", strategy.long,100, comment = "買Mid-term")
buyclose1=crossunder(close,upper*0.999)
if (macd<0 or f3<f6)
    strategy.close("buy1", comment = "關Mid-term")
//strategy.close("buy1",when=cross(basis,close), comment = "關M",qty_percent=50)
strategy.close("buy1", when = buyclose1, comment = "關Mid-term",qty_percent=100)
//多策略3
if (inDateRange and  (macd>0) and crossunder(low,f1) and f1>f4) //
    strategy.entry("buy3", strategy.long,1, comment = "買Short-term")
buyclose3=crossunder(close,upper*0.999)
if (macd<0 or f1<f4)
    strategy.close("buy3", comment = "關Short-term")
strategy.close("buy3", when = buyclose3, comment = "關Short-term")
//多策略4
if (inDateRange and  (macd>0) and crossunder(low,f5) and f4>f5) //
    strategy.entry("buy4", strategy.long,1, comment = "買Long-term")
buyclose4=crossunder(close,upper*0.999)
if (macd<0 or f4<f6)
    strategy.close("buy4", comment = "關Long-term")
strategy.close("buy4", when = buyclose4, comment = "關Long-term")

//空策略1
if (inDateRange and  (macd<0) and crossunder(high,f1) and f1<f3 and f3<f6) //
    strategy.entry("sell1", strategy.short,1, comment = "空Short-term")
sellclose1=crossunder(lower*0.999,close)
if (macd>0 or f1>f4)
    strategy.close("sell1", comment = "關空Short-term")
strategy.close("sell1", when = sellclose1, comment = "關空Short-term")
//空策略2
if (inDateRange and  (macd<0) and crossunder(high,f4) and f4<f6) //
    strategy.entry("sell2", strategy.short,1, comment = "空Mid-term")
sellclose2=crossunder(lower,close)
if (macd>0 or f4>f6)
    strategy.close("sell2", comment = "關空Mid-term")
strategy.close("sell2", when = sellclose2, comment = "關Mid-term")
//空策略3
if (inDateRange and (macd<0) and crossunder(high,f6)) //
    strategy.entry("sell3", strategy.short,1, comment = "空Long-term")
sellclose3=crossunder(lower,close)
if (macd>0 or f6>f7)
    strategy.close("sell3", comment = "關空Long-term")
strategy.close("sell3", when = sellclose3, comment = "關空Long-term")
Detail
https://www.fmz.com/strategy/437381
Last Modified
2024-01-02 10:53:06