Name
KDJ阳线突破买入策略KDJ-Golden-Cross-Long-Entry-Strategy
Author
ChaoZhang
Strategy Description
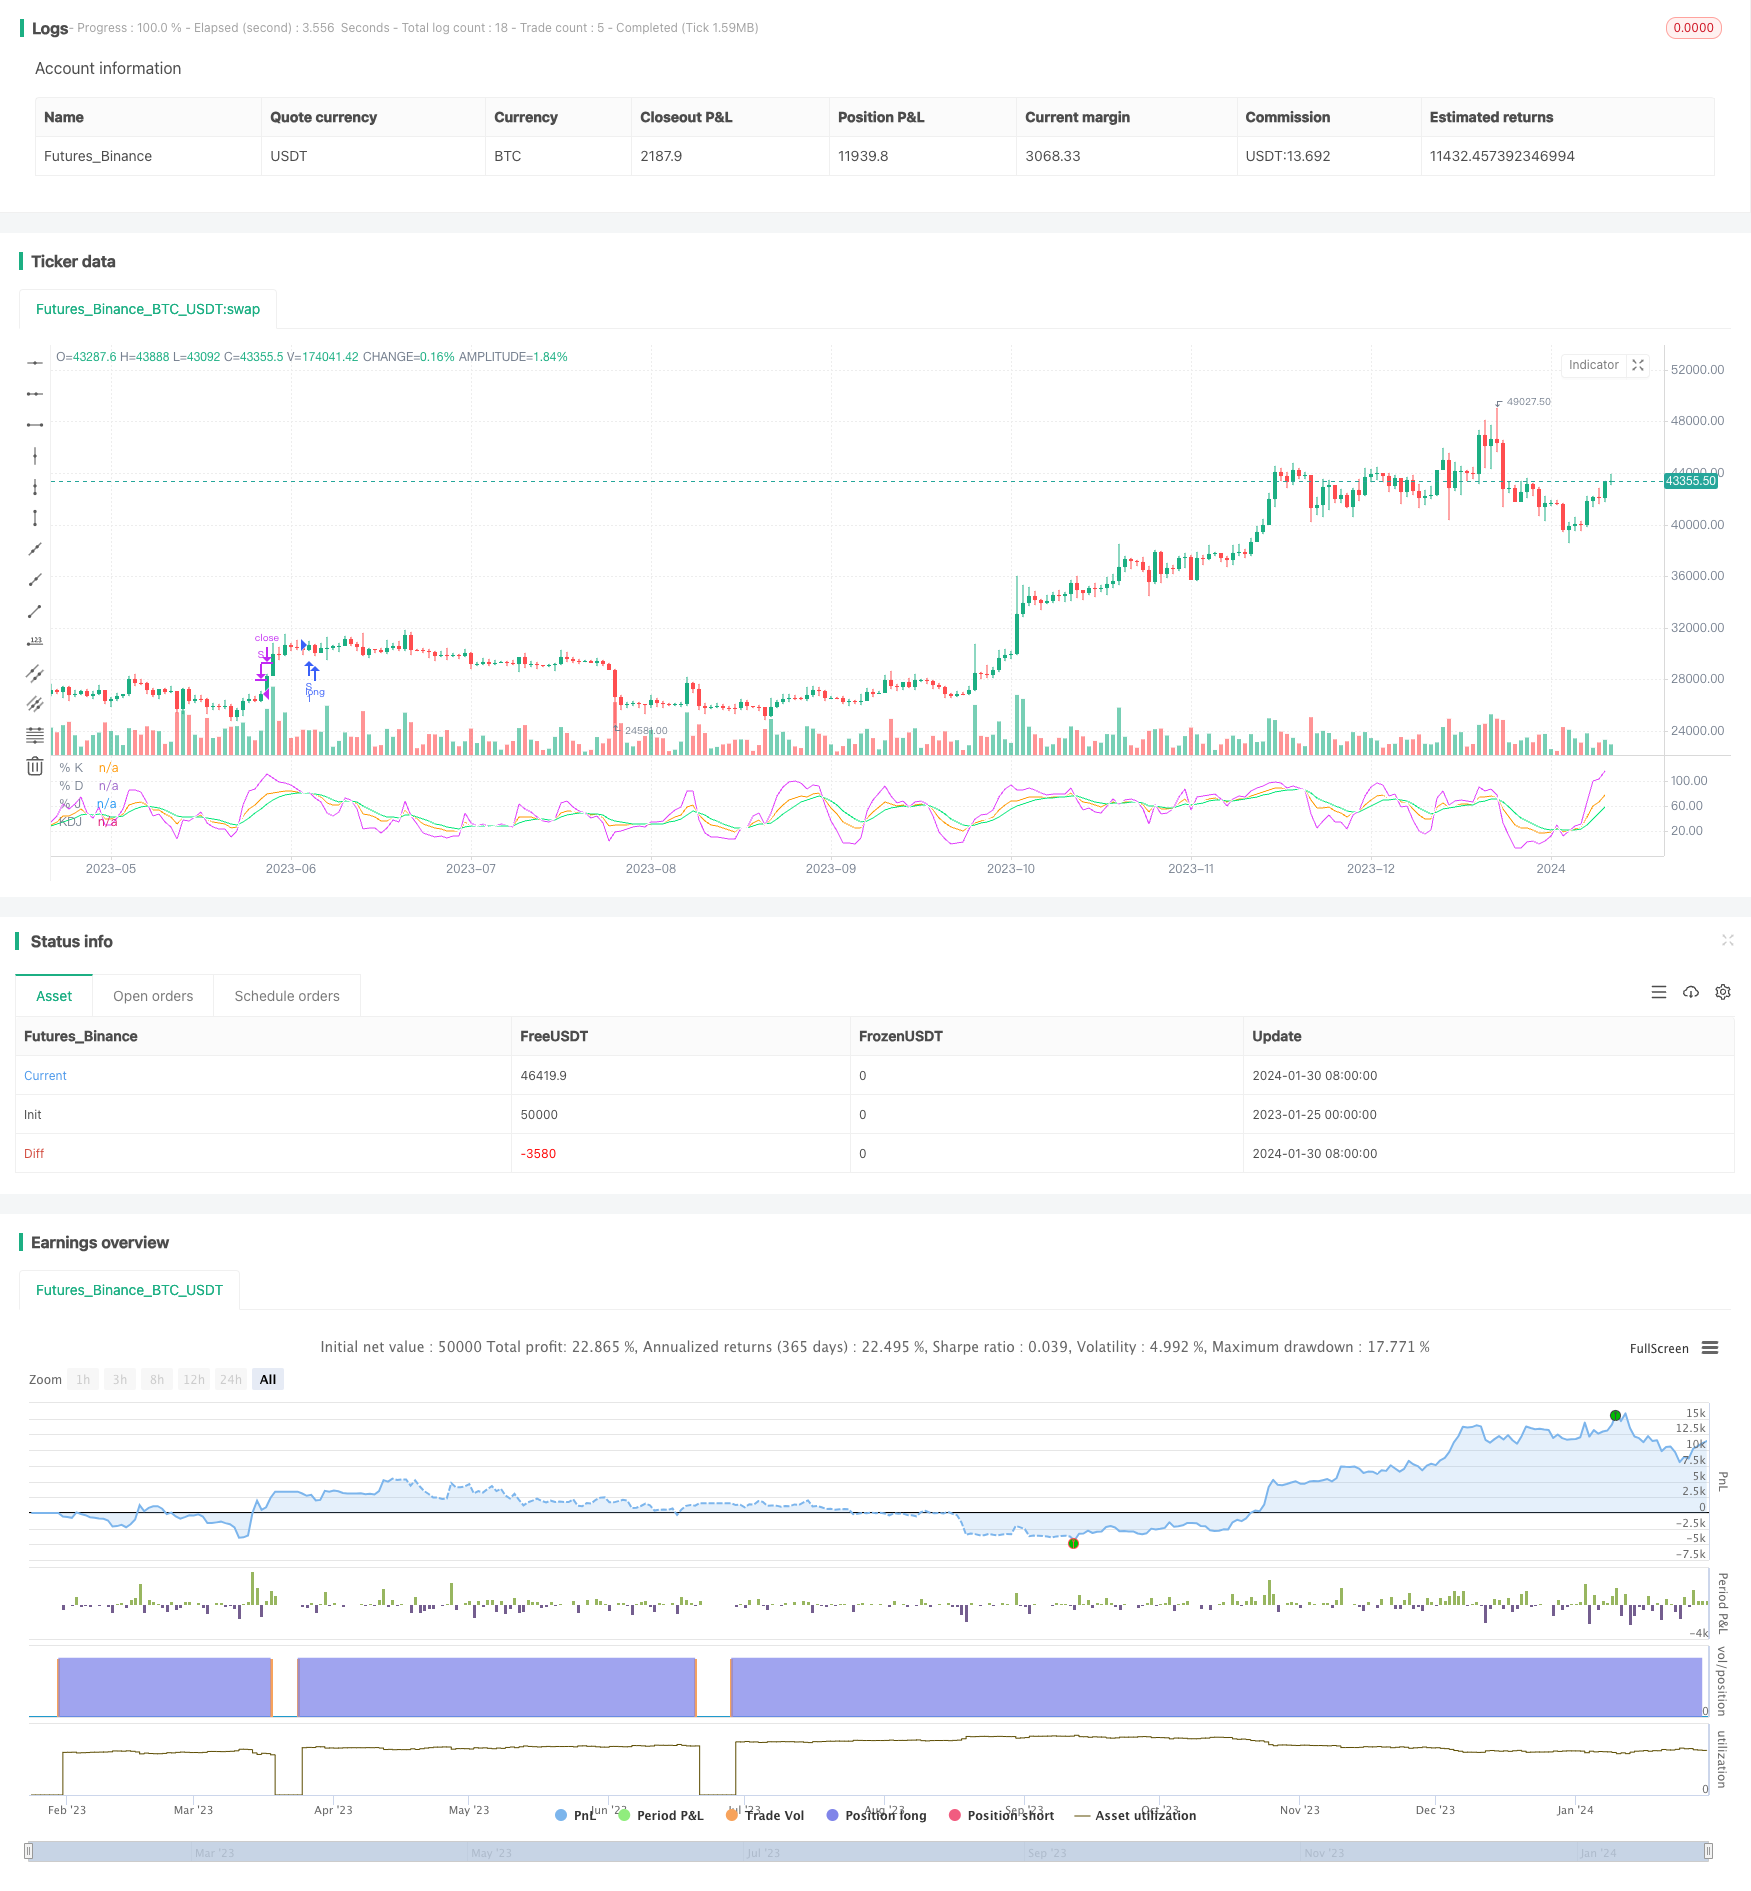
KDJ阳线突破买入策略是基于KDJ指标的一个量化交易策略。该策略主要利用KDJ指标的J线和D线的黄金交叉形成买入信号,在J线上穿D线时做多入场。该策略较为简单,容易实施,适合量化交易的初学者。
该策略使用的主要技术指标是KDJ指标。KDJ指标包含K线、D线和J线。其中:
K值=(当日收盘价-N日内最低价)÷(N日内最高价-最低价)×100;
D值=K值的M日移动平均;
J值=3K-2D。
根据KDJ指标的设定,当J值上穿D值时,表明股价反转上涨,可以做多;当J值下穿D值时,表明股价反转下跌,可以做空。
该策略就是利用上述规则,在J线上穿D线时,即金叉形成时,判断为买入信号,做多入场。 exitsignal为J线大于100时退出做多头寸。
-
使用KDJ指标判断买入时机,该指标综合考虑了股价涨跌信息,较为可靠。
-
策略信号判断规则简单清晰,容易理解实施,适合量化交易初学者。
-
采用了止盈止损策略,可以有效控制风险。
-
策略参数优化空间大,实施灵活。
-
KDJ指标容易形成虚假信号,可能导致亏损。
-
买入后市场短线调整可能使止损退出,无法捕捉大趋势。
-
参数设置不当可能导致交易频繁或信号不明显。
-
需关注交易成本对总体盈利的影响。
主要风险控制方法:合理优化参数,跟踪指数增强,适当放宽止损范围等。
-
优化KDJ的参数,寻找最佳参数组合。
-
增加过滤条件,避免虚假信号。可结合其他指标或形态进行过滤。
-
可以根据市场类型(牛熊市)选择不同的参数设置。
-
可以适当放宽止损幅度,以减少止损退出的概率。
-
可以结合交易量等指标分析,避免被套。
KDJ阳线突破买入策略整体较为简单实用,容易上手实施,特别适合量化交易的初学者。该策略有一定的交易优势,但也存在一些风险,需要针对性地进行优化,才能全面发挥策略价值。总体而言,该策略值得重点研究与应用。
||
The KDJ Golden Cross Long Entry Strategy is a quantitative trading strategy based on the KDJ indicator. This strategy mainly uses the golden cross of the J line and D line of the KDJ indicator to generate buy signals and goes long when the J line crosses above the D line. The strategy is relatively simple and easy to implement, suitable for beginners of quantitative trading.
The main technical indicator used in this strategy is the KDJ indicator. KDJ indicator consists of the K line, D line and J line. Where:
K = (Current Close - Lowest Low over the past N days) ÷ (Highest High over the past N days - Lowest Low over the past N days) x 100;
D = M-day moving average of K;
J = 3K - 2D.
According to the KDJ indicator rules, when J line crosses above D line, it indicates that prices are reversing upward and long positions can be taken; when J line falls below D line, it signals that prices are reversing downward and short positions can be initiated.
This strategy utilizes the above rules and generates buy signals when the J line crosses above the D line, i.e. a golden cross forms, to go long. The exit signal is when J goes above 100 to close long positions.
-
Using the KDJ indicator to determine entry timing which incorporates price up and down movements, thus more reliable.
-
The strategy has clear and simple signal rules which are easy to understand and implement, suitable for beginners.
-
Adopted stop profit and stop loss to effectively control risks.
-
Large room for parameter optimization and flexible implementation.
-
KDJ indicator tends to generate false signals leading to losses.
-
Market short-term adjustments after buying may trigger stop loss exiting and miss major trends.
-
Improper parameter settings may lead to overtrading or unclear signals.
-
Need to consider transaction costs' impact on overall profitability.
Main risk management methods: Optimize parameters properly, track indexes to enhance, appropriately expand stop loss range, etc.
-
Optimize parameters of KDJ to find best parameter combinations.
-
Add filtering conditions to avoid false signals. Can combine other indicators or formations for filtration.
-
Can choose different parameter settings based on market types (bull or bear markets).
-
Can appropriately expand stop loss range to reduce the probability of stop loss exits.
-
Can combine trading volume and other indicators for analysis to avoid being trapped.
The KDJ Golden Cross Long Entry Strategy is relatively simple and practical overall, easy for beginners to get started and implement. The strategy has certain trading advantages but also has some risks. It needs targeted optimization in order to fully realize the strategy value. Overall, the strategy deserves key research and application.
[/trans]
Strategy Arguments
| Argument | Default | Description |
|---|---|---|
| v_input_1 | 9 | period |
| v_input_2 | 3 | signal |
| v_input_float_1 | 1.2 | Profit Margin |
| v_input_float_2 | 0.98 | Stop Loss Margin |
| v_input_int_1 | true | Start Date |
| v_input_int_2 | true | Start Month |
| v_input_int_3 | 2023 | Start Year |
| v_input_int_4 | true | End Date |
| v_input_int_5 | true | End Month |
| v_input_int_6 | 2024 | End Year |
Source (PineScript)
/*backtest
start: 2023-01-25 00:00:00
end: 2024-01-31 00:00:00
period: 1d
basePeriod: 1h
exchanges: [{"eid":"Futures_Binance","currency":"BTC_USDT"}]
*/

//  ## !<------------------ Script -------------------------->
//@version=5
strategy('KDJ NVDA', shorttitle='KDJ')

ilong = input(9, title='period')
isig = input(3, title='signal')

bcwsma(s, l, m) =>
    _bcwsma = float(na)
    _s = s
    _l = l
    _m = m
    _bcwsma := (_m * _s + (_l - _m) * nz(_bcwsma[1])) / _l
    _bcwsma

// profit strategy add
profit_m = input.float(1.20,"Profit Margin",minval=1.0,maxval=1.99,step=0.05)
stop_m = input.float(0.98,"Stop Loss Margin",minval=0.0,maxval=1,step=0.05)

// Make input options that configure backtest date range
startDate = input.int(title="Start Date", defval=1, minval=1,maxval=31)
startMonth = input.int(title="Start Month", defval=1,minval=1,maxval=12)
startYear = input.int(title="Start Year", defval=2023,minval=2018,maxval=2024)
endDate = input.int(title="End Date", defval=1, minval=1,maxval=31)
endMonth = input.int(title="End Month", defval=1,minval=1,maxval=12)
endYear = input.int(title="End Year", defval=2024,minval=2018,maxval=2099)

// intialization of variables
// Look if the close time of the current bar
// falls inside the date range
inDateRange = (time >= timestamp(syminfo.timezone, startYear,startMonth, startDate, 0, 0)) and (time < timestamp(syminfo.timezone, endYear, endMonth, endDate, 0, 0))

c = close
h = ta.highest(high, ilong)
l = ta.lowest(low, ilong)
RSV = 100 * ((c - l) / (h - l))
pK = bcwsma(RSV, isig, 1)
pD = bcwsma(pK, isig, 1)
pJ = 3 * pK - 2 * pD
KDJ = math.avg(pD, pJ, pK)

go_long= ta.crossunder(pD,pJ)


if (inDateRange and go_long)
    strategy.entry("S",strategy.long,comment="C")
	// strategy.exit("S", limit=c*profit_m, stop=c*stop_m, comment="SL/SP")

if (inDateRange and pJ > 100)
	strategy.close("S", comment="TP")

// Plot options
// plot(pK, color= #1E88E5)
// plot(pD, color=#FF6F00)
// plot(ma, color=color.yellow)
// bgcolor(pJ>pD? color.green : color.red)

plot(pK, title='% K', color=color.new(color.orange, 0))
plot(pD, title='% D', color=color.new(color.lime, 0))
plot(pJ, title='% J', color=color.new(color.fuchsia, 0))
plot(KDJ, title='KDJ', color=color.new(color.white, 0))
// </PINE> </SCRIPT>
// ## This source code is subject to the terms of the ozilla Public License 2.0 at https://mozilla.org/MPL/2.0/
// ## !<------------------ End Script -------------------------->
Detail
https://www.fmz.com/strategy/440679
Last Modified
2024-02-01 10:28:12