JBoss Tools 4.5 and Red Hat JBoss Developer Studio 11.0 for Eclipse Oxygen are here waiting for you. Check it out!
JBoss Developer Studio comes with everything pre-bundled in its installer. Simply download it from our JBoss Products page and run it like this:
java -jar jboss-devstudio-<installername>.jar
JBoss Tools or Bring-Your-Own-Eclipse (BYOE) JBoss Developer Studio require a bit more:
This release requires at least Eclipse 4.7 (Oxygen) but we recommend using the latest Eclipse 4.7 Oxygen JEE Bundle since then you get most of the dependencies preinstalled.
Once you have installed Eclipse, you can either find us on the Eclipse Marketplace under "JBoss Tools" or "Red Hat JBoss Developer Studio".
For JBoss Tools, you can also use our update site directly.
http://download.jboss.org/jbosstools/oxygen/stable/updates/
Our main focus for this release was on adoption of Eclipse Oxygen, improvements for container based development and bug fixing. Eclipse Oxygen itself has a lot of new cool stuff but let me highlight just a few updates in both Eclipse Oxygen and JBoss Tools plugins that I think are worth mentioning.
Some operations (logs, file synchronization) require the user of the oc CLI client. It was possible to specific a single instance of the used oc CLI tool for the whole workspace. This may cause some trouble when working simultaneously with several OpenShift clusters (that may have different version levels). It is now possible to specify the oc CLI tool on the connection level. This is optional, and the default is to use the oc CLI tool specified at the workspace level.
The connection specific oc CLI tool is accessible through the OpenShift connection edit dialog with the Advanced button:
Enable the Override 'oc' location' flag and select a specific oc CLI tool for this connection through the *Browse button:
OpenShift connections created by the CDK server adapter will automatically have a specific oc CLI tool set as the CDK installs locally an oc CLI tool that is aligned with the embedded OpenShift version.
The OpenShift server and Kubernetes server versions are now displayed in the OpenShift connection properties. This information is retrieved using an un-authenticated request login to the OpenShift cluster is not required. This allow user to verify the OpenShift and Kubernetes level when interacting.
Here is an example based on an OpenShift connection against CDK3:
if the cluster is not started or accessible, then no values are displayed:
Support has been added when launching commands in a Container to specify a security option profile. This can be done in lieu of specifying privileged mode. For example, to run gdbserver, one can specify "seccomp:unprofiled" to allow ptrace commands to be run by the gdb server.
The Run Image Wizard has been modified to allow specifying an unconfined seccomp profile to replace the default seccomp profile.
Security options are also now shown in the Properties View.
The Eclipse Docker Tooling Feature now contains a plugin that integrates with the Java Development Tools (JDT). This permits the running and debugging of Eclipse Java projects within containers. The functionality is provided through the context menu under the 'Run As' and 'Debug As' options. The daemon connection used, as well as the image chosen are configurable through launch configurations.
This is intended to work in the same way that a regular run/debug session works.
A server adapter has been added to work with EAP 7.1. It’s currently released in Tech-Preview mode only, since the underlying WildFly 11 continues to be under active development with substantial opportunity for breaking changes. This new server adapter includes support for incremental management deployment like it’s upstream WildFly 11 counterpart.
We are happy to finally announce support for Beans (Spring / Blueprint).
Using the Route Editor you can now access Spring / Blueprint Beans in your Camel Context through the Configurations tab.
In the Configurations tab you can see all global configuration elements of your Camel Context. You can Add, Edit and Delete elements using the buttons on the right side.
By clicking the Add or Edit button a wizard will be openend to guide you on the creation of the Bean.
In the wizard you can select an existing bean class from your project or create a new bean class. You can also specify constructor arguments and bean properties.
Once created you can then modify the properties of that Bean inside the Properties view.
We are glad to announce the support of the Hibernate Search. The project was started by Dmitrii Bocharov in the Google Summer Code program and has been successfully transferred in the current release of the JBoss Tools from Dmitrii’s repository into the jbosstools-hibernate repository and has become a part of the JBoss family of tools.
The plugin was thought to be some kind of a Luke tool inside Eclipse. It was thought to be more convenient than launching a separate application, and picks up the configuration directly from your Hibernate configuration.
Two options were added to the console configurations submenu: Index Rebuild and Index Toolkit. They become available when you use hibernate search libraries (they exist in the build path of your application, e.g. via maven).
When introducing Hibernate Search in an existing application, you have to create an initial Lucene index for the data already present in your database.
The option "Index Rebuild" will do so by re-creating the Lucene index in the directory specified by the hibernate.search.default.indexBase property.
"Open Index Toolkit" submenu of the console configuration opens an "Index Toolkit" view, which has three tabs: Analyzers, Explore Documents, Search.
This tab allows you to view the result of work of different Lucene Analyzers. The combo-box contains all classes in the workspace which extend org.apache.lucene.analysis.Analyzer, including custom implementations created by the user. While you type the text you want to analyse, the result immediately appears on the right.
After creating the initial index you can now inspect the Lucene Documents it contains.
All entities annotated as @Indexed are displayed in the Lucene Documents tab.
Tick the checkboxes as needed and load the documents. Iterate through the documents using arrows.
The plugin passes the input string from the search text box to the QueryParser which parses it using the specified analyzer and creates a set of search terms, one term per token, over the specified default field. The result of the search pulls back all documents which contain the terms and lists them in a table below.
The included Forge runtime is now 3.7.2.Final. Read the official announcement here.
Maven integration has been a long time first class citizen in Red Hat JBoss Developer Studio. Gradle is now having the same level. You can now manage Gradle projects in the base Red Hat JBoss Developer Studio installation. For more information, please see Buildship documentation.
The Always run in background preference is now enabled by default. If you prefer to see a progress dialog for long-running operations, you can disable this option on the General preference page.
The styling of the window toolbar has been improved. On Windows, the toolbar color is now consistent with the color of the perspective switcher.
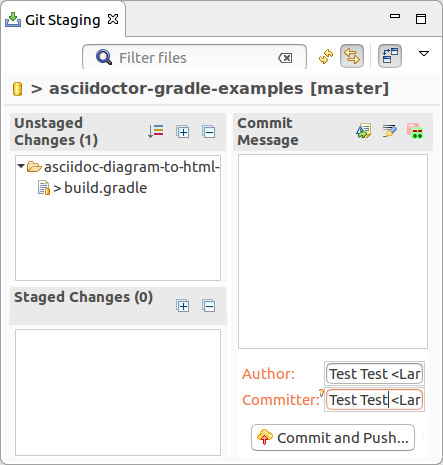
The default styling for form-based user interfaces was changed to use a flat, gray style. This change was inspired by the popular "Clean Sheet" plug-in. Below you see screenshots of the MANIFEST.MF editor and the Git Staging view in this new design.
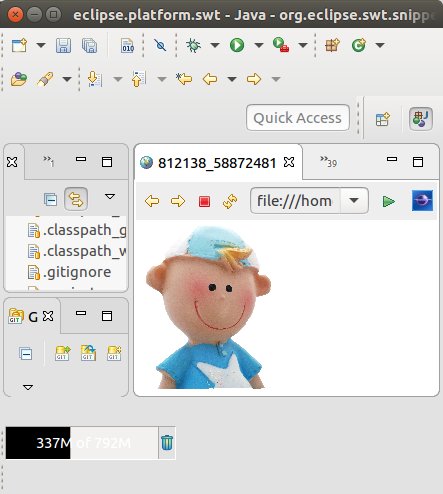
Image files are now opened directly in Eclipse by default. The Internal Web Browser has been registered as default editor for files with the png, jpg, jpeg, gif, bmp, and ico extensions.
Use Open With > System Editor to open files in the default external program.
The Help > Installation Details menu entry has been removed. You can access this dialog via Help > About > Installation Details or via Quick Access (Ctrl+3) and then typing "Installation Details".
The Maximize and Minimize Active View or Editor menu items have been moved to the Window > Appearance menu. They used to be in the Window > Navigate menu.
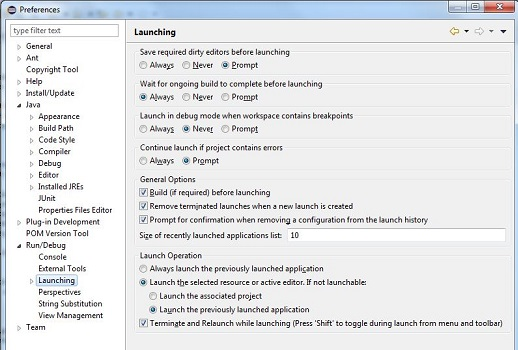
A Terminate and Relaunch option is now available while launching from Run menu, context menu and tool bar. The default setting is to launch without terminating previous launches. To enable automatic termination, select the option Terminate and Relaunch while launching on Preferences > Run/Debug > Launching. The behavior not selected on the preference page can also be activated on-demand by holding the Shift key while launching the configuration from history.
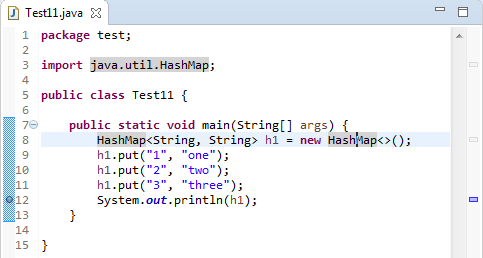
Breakpoints are now visible in the Overview Ruler by default.
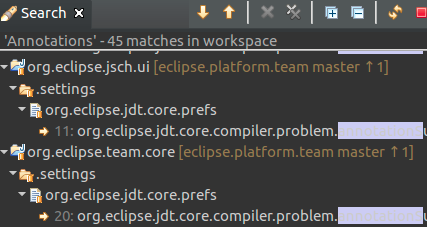
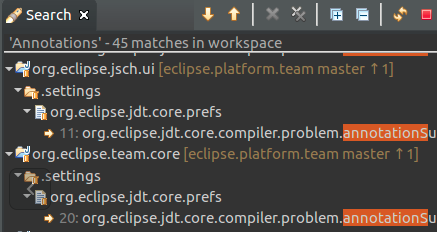
To configure the rendering of annotations, right-click the overview ruler and choose Preferences…. This directly opens the preference page General > Editors > Text Editors > Annotations.
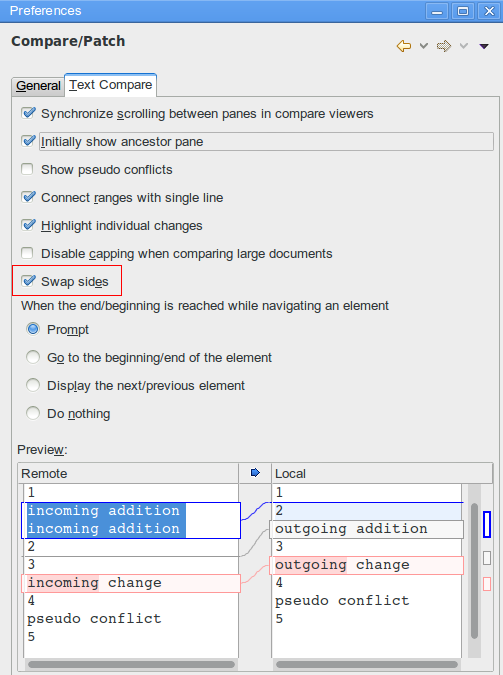
Compare editors now offer a button Swap Left and Right View.
The direction of comparison is preserved between invocations of the Compare editor and can also be changed in the Compare/Patch preference page.
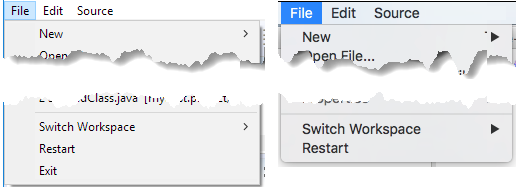
The Switch Workspace and Restart menu items are now at the bottom of the File menu: just above the Exit item on Windows and Linux, and as last menu items on the Mac.
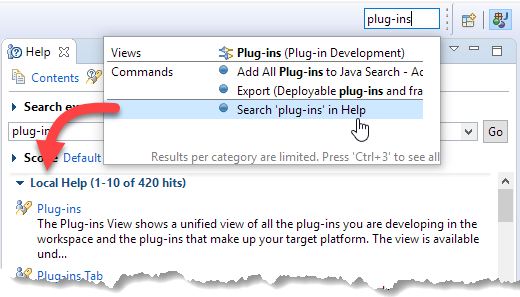
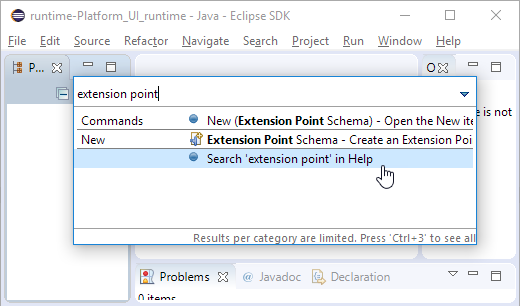
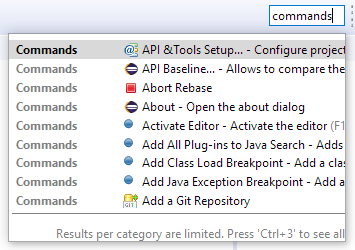
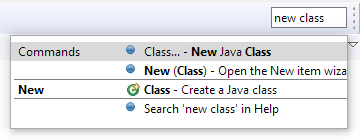
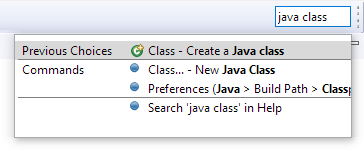
You can now Search in Help after you’ve entered text in the Quick Access dialog. The option is shown when the filter text is longer than three characters, and it is always added at the end of the results.
Search in Help using the new Quick Access dialog:
Search in Help using the standalone dialog:
Quick Access (Ctrl+3) now shows the icon for a Command if available. Otherwise, it still shows the default blue ball.
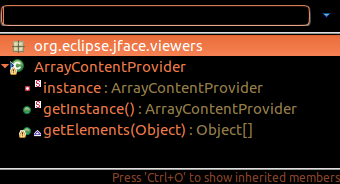
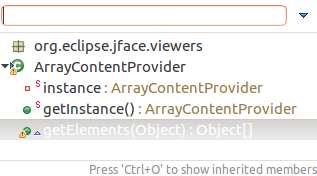
Interactive popups like JDT’s Quick Outline don’t use the platform’s tooltip colors any more, since those were sometimes hard to read.
Old style:
New style:
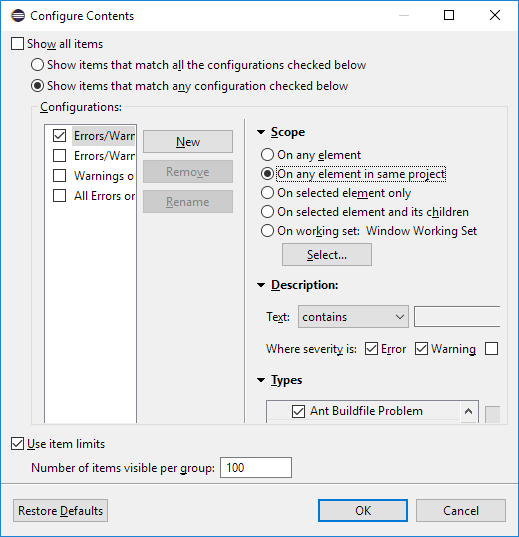
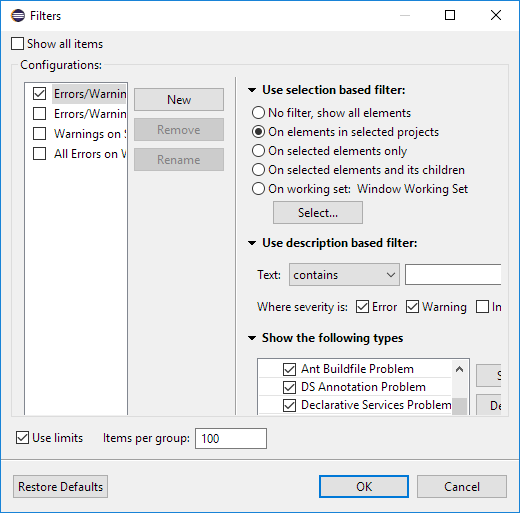
The Filters dialog of the Problems, Bookmarks, and Tasks views has been simplified. If you select several configurations, items matching any of these configurations will be shown.
Old dialog in Problems view:
New dialog in Problems view:
The Filters dialog is now accessible from the toolbar of the Problems, Bookmarks, and Tasks views.
Previously, it was only accessible via view menu > Configure Contents…:
Now also as a toolbar button:
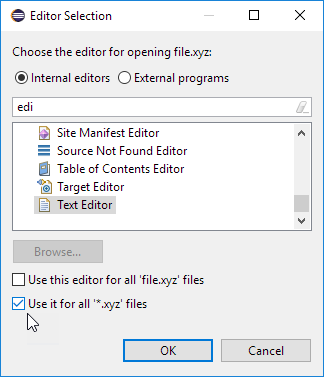
The Editor Selection dialog now offers a one-click option for choosing the editor that should open all files with the same extension in the future.
Example when selecting "file.xyz" and choosing Open with > Other…:
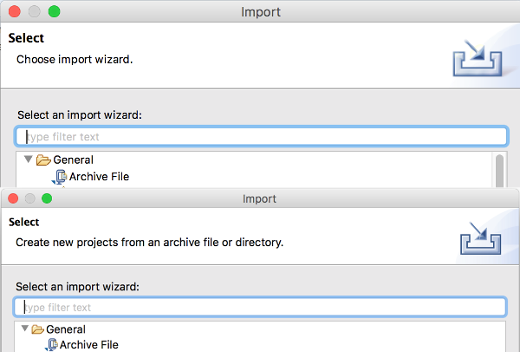
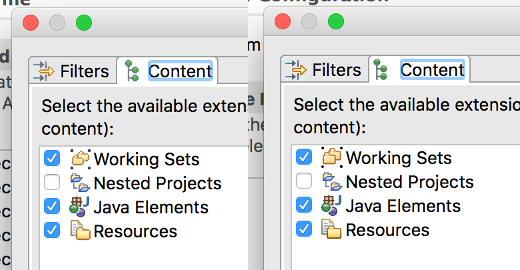
More images in the old GIF format were replaced by images in the PNG format. In addition, high resolution images where added. As PNG can handle transparency much better than GIF, the ugly white borders around shapes visible in the dark theme are now gone for these icons.
To see their full beauty, a high-DPI monitor (e.g. a Retina Mac) is needed. The lower part of the screenshot shows the wizard banner image of the Import dialog in high resolution.
The right part of the screenshot shows all the icons in high resolution.
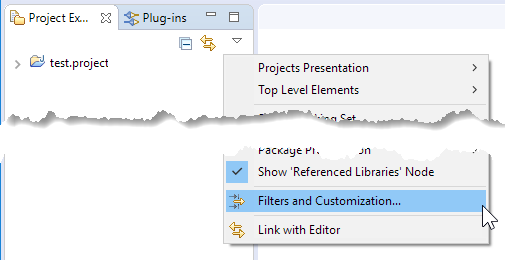
The Customize View… command in the Project Explorer's view menu has been renamed to Filters and Customization…
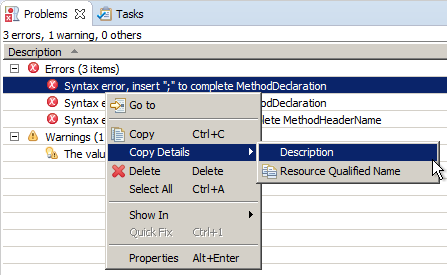
You can copy the description or the resource qualified name of an error, warning, or task into the clipboard using commands in the Copy Details context menu.
For files checked out from CVS, the Show Annotation command in the text editor’s vertical ruler and in the Team menu has been renamed to Show Revision Information. This change has been synchronized with the Eclipse Git team provider, so future versions of EGit will use the same name.
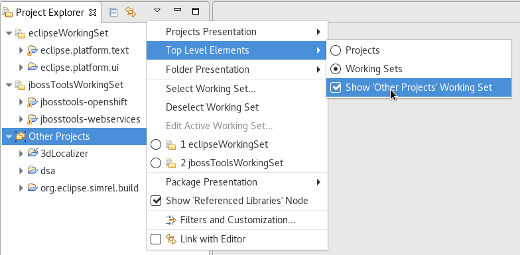
If you’re using the Project Explorer and working sets as top-level elements, the Top Level Elements view menu now provides a way to show an Other Projects group for projects that are not in one of the currently active working sets.
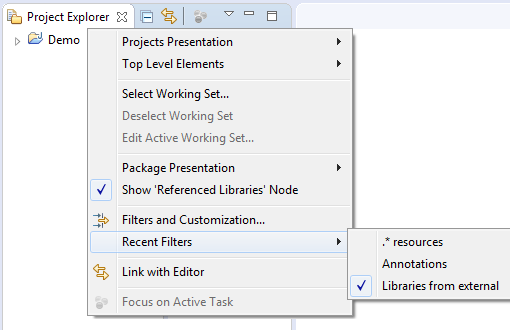
The Project Explorer view now has a Recent Filters menu that shows the most recently used filters.
The window margins have been reduced to provide more space in the IDE.
Old style:
New style (see the reduced space below the Quick Access box).
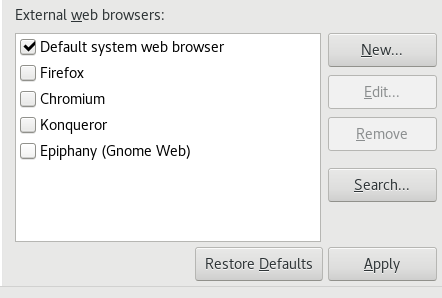
On Linux, the list of recognized external browsers has been updated to include:
-
Firefox (/usr/bin/firefox)
-
Chrome (/usr/bin/google-chrome)
-
Chromium (/usr/bin/chromium-browser)
-
Epiphany/Gnome Web (/usr/bin/epiphany)
-
Konqueror (/usr/bin/konqueror)
SWT now stores the GTK theme used at launch time in a system property, org.eclipse.swt.internal.gtk.theme. This property can help with troubleshooting
issues that are specific to certain themes. It can be viewed in About > Installation Details > Configuration.
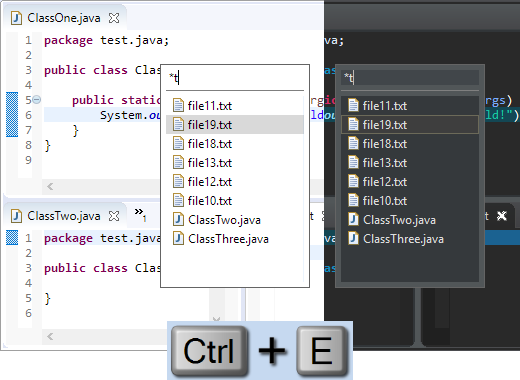
You can use the Quick Switch Editor (Ctrl+E) command to list and filter all the open editors. This works now also if you have selected a view in the editor area. You can filter the list using wildcards, and select editors using mouse or keyboard.
Now you can also cycle through the list by pressing Ctrl+E again. Or use Arrow Up/Down as before.
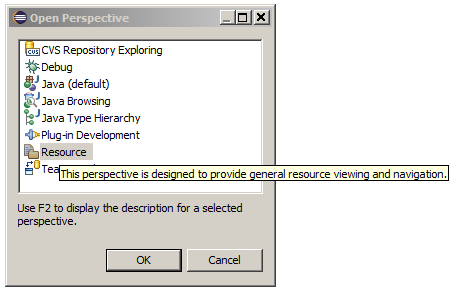
You can now see the description for a perspective (if provided by the contributing plug-in) by pressing F2 in the Open Perspective dialog.
You can now search for partial descriptions in Quick Access (Ctrl+3). The search result matches space-separated words in the search string. For example, searching for "clone repo", will match the "Clone a Git Repository" command.
The improved string matching works also in case of parenthesis, or when the search string matches the category name.
The Quick Access (Ctrl+3) result list does not show duplicate elements anymore. Now, if a search result element is already in the "Previous Choices" category, it is no longer shown in another category.
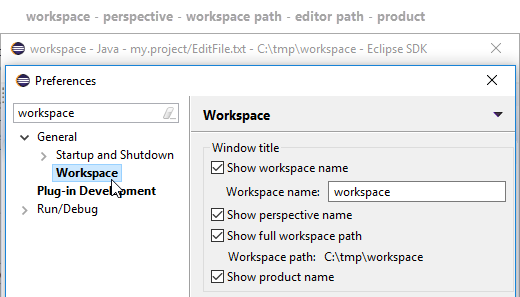
The title window is now simpler and you can configure it from Preferences. By default the title displays workspace name, editor path and product name.
You can now use Preferences > Workspace to choose what to display in the window title: workspace name, perspective name, workspace path, and product name.
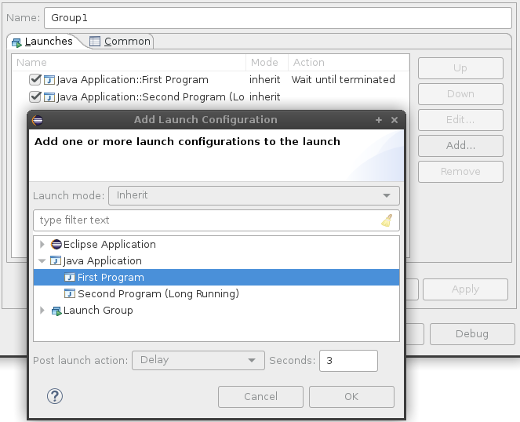
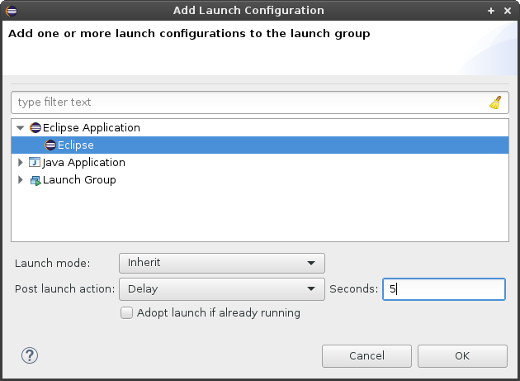
The new Launch Group launch configuration type allows you to launch multiple other launch configurations sequentially, with configurable actions after launching each group member:
-
None: Continue launching the next member right away
-
Wait until terminated: Continue launching the next member only after this member has terminated
-
Delay: Delay launching the next member for a given amount of seconds.
New launch groups can be created via the Run > Run Configurations… or Run > Debug Configurations… dialogs.
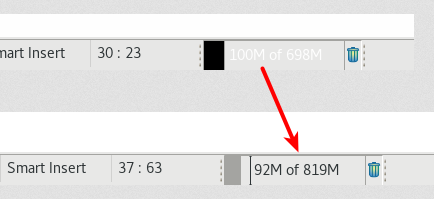
The heap status had poor contrast on Linux since GTK3.04. This has been resolved for the heap status to look consistent across all platforms.
The Progress view has been adjusted for the Eclipse dark theme.
Before:
After:
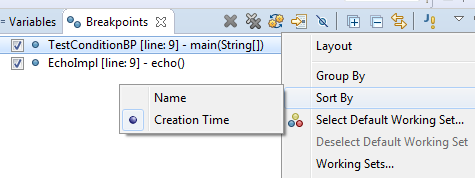
In the Breakpoints view’s view menu, a new Sort By option has been added. This allows sorting by two ways:
-
Name: Current default order, sorts by the displayed name
-
Creation Time: Newly created breakpoints will be shown on top
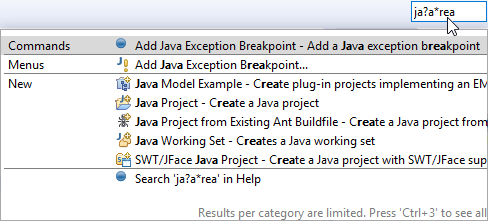
You can now use * and ? as wildcards to filter Quick Access (Ctrl+3) items. The match ranges are displayed in bold.
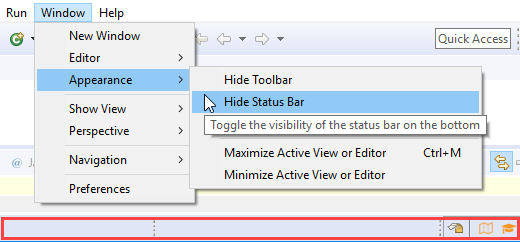
You can now hide and show the bottom status bar via menu: Window > Appearance > Hide (Show) Status Bar.
In Quick Access, the command is called Toggle Statusbar.
The UI for the new Launch Groups feature in the Run/Debug Configurations… dialog has been reworked to be more intuitive and user friendly. Also, additional configuration possibilities have been added:
-
'Wait for console output (regexp)' post launch action: Allows to delay further processing of launch group elements until a certain output (matching a regular expression) appears on the console of the given group element.
-
'Adopt launch if already running': Allows to control the behaviour of the group when the launch configuration referenced by the launch group element is already running (no matter who launched it). If checked, the launch configuration will not be launched again if it is running already. The existing launch will be adopted by the group (i.e. terminating the group will also terminate this launch). Any configured post launch action will still be executed!
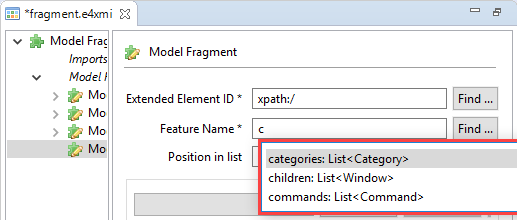
You can now use Ctrl+Space to trigger content assist when selecting the Feature Name in the Model Editor.
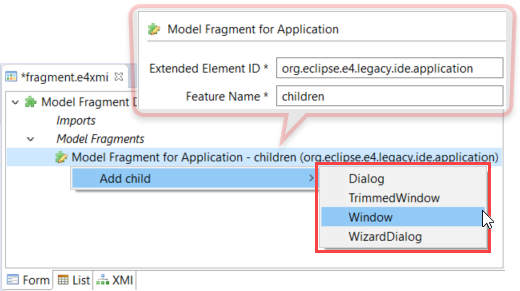
The elements proposed in the Add child menu are now filtered to a minimal list containing allowed elements only.
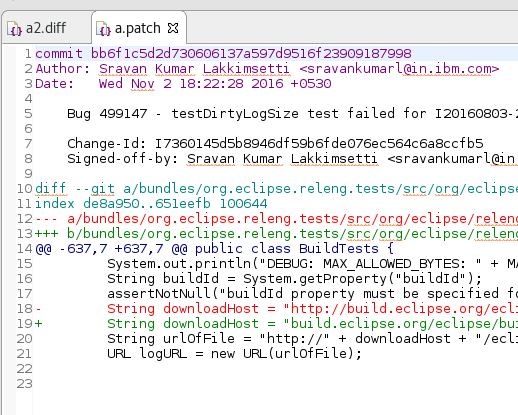
An extension was provided to the generic editor so that it now can provide syntax highlighting for files with the .patch or .diff extension.
Right-click the file and choose Open with > Generic Text Editor to see the editor in action.
The exit and restart dialogs now use verbs instead of OK/No/Yes, which makes the dialogs more direct and specific.
CSS definitions for preferences can now use pseudo selectors. This allows that other plug-ins extend preference CSS nodes, instead of overriding them. This makes the default Eclipse dark theme much more consistent and usable.
Example styling with EGit installed before this development:
Example styling with EGit installed after this development:
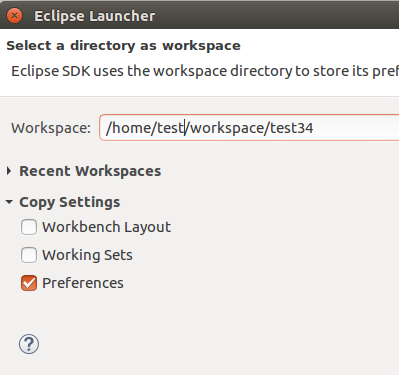
You can now copy your preferences during a switch to a new or existing workspace.
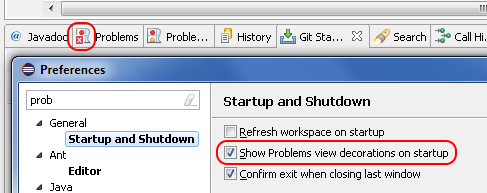
By default, the Problems view icon no longer shows an errors/warnings overlay after startup, unless the Problems view is on top of the view stack. To enable the errors/warnings overlay also if the Problems view is minimized or not on top, a new Show Problems view decorations on startup option has been added to Preferences > General > Startup and Shutdown. By default, this preference is disabled.
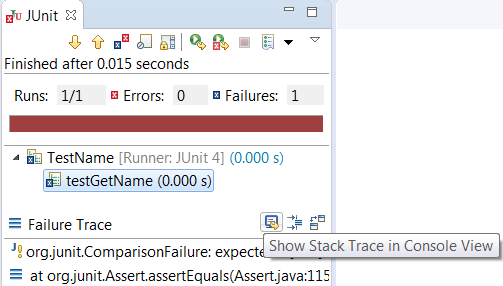
A new button has been added to the JUnit Failure Trace header to show the stack trace of a failed JUnit test in the Console view. The Console view makes it convenient to view a long and wide stack trace, copy parts of the stack trace and navigate to the classes on the stack trace using hyperlinks.
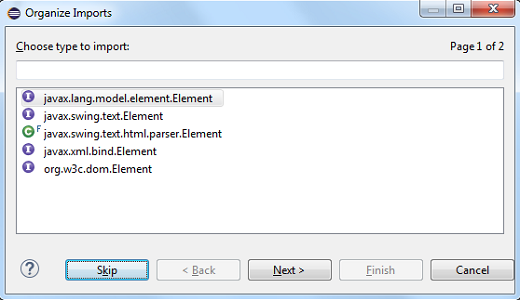
While using the Organize Imports dialog to import multiple unresolved types, you can now skip a type without cancelling the whole operation by using the new Skip button. No import statement is added for the skipped type.
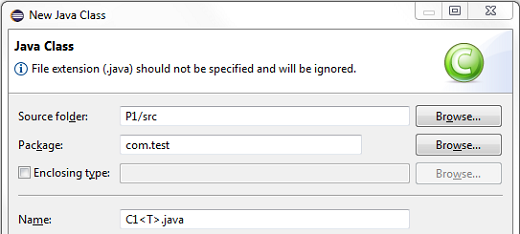
New Java Type creation wizards now accept the .java extension with the type name instead of showing the error message: "Type name must not be qualified".
For example, to create a new class com.test.C1<T>.java, you can directly paste this qualified type name with extension in the Name field of the New Java Class wizard.
During debugging, the last method result (per return or throw) that was observed during Step Into, Step Over or Step Return, is shown as first line in the Variables view.
This can be disabled with the new option Preferences > Java > Debug > Show method result after a step operation (if supported by the VM; may be slow)
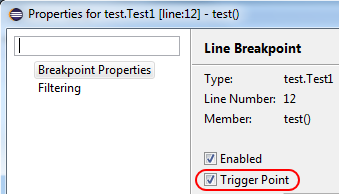
You can now define a set of triggers for the breakpoints in a workspace
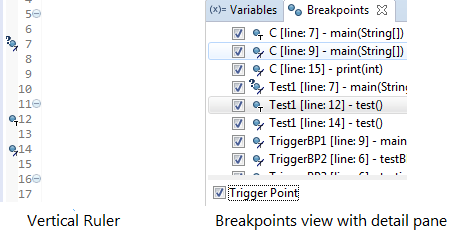
Any breakpoint can be set as a trigger point by using Breakpoint Properties… dialog or the Breakpoints view’s detail pane.
Triggers will be rendered with an overlay of "T" and the breakpoints suppressed by the triggers will be rendered with an overlay of "T" with a cut. All the other breakpoints that are initially suppressed by triggers will be hit only after any of the trigger points has been hit. All the triggers are disabled after a trigger point is hit and will be re-enabled after the run.
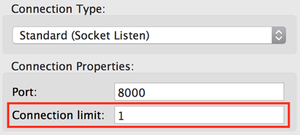
The Remote Java Application debug configuration’s Standard (Socket Listen) connection type now supports incoming connections from multiple VMs. This is useful for debugging distributed systems. The connection limit may be set to a fixed number, or 0 for unlimited connections.
You can now disable Hot Code Replace (HCR) if it causes any trouble or if you want to avoid code changes in a debug target. HCR is enabled by default but can be disabled in Preferences > Java > Debug.
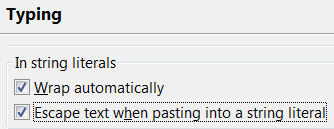
The Java > Editor > Typing > Escape text when pasting into a string literal preference option is now enabled by default. This will escape the special characters in pasted strings when they are pasted into an existing string literal.
To paste without escaping, you can either paste outside of a string literal, or you can disable Edit > Smart Insert Mode.
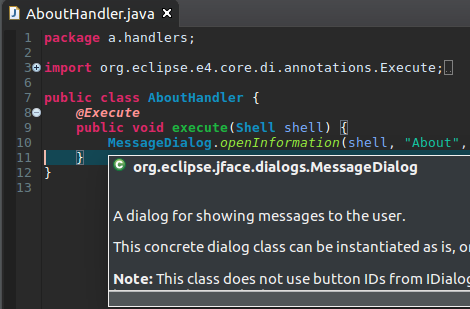
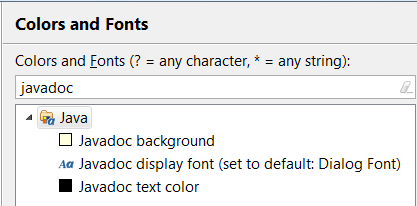
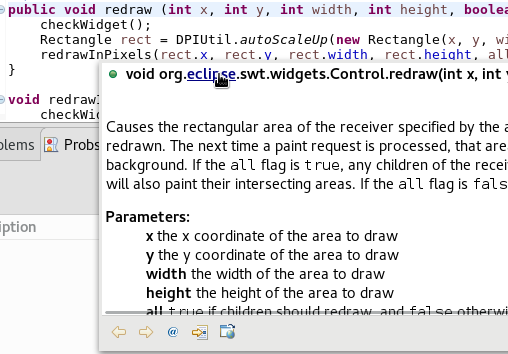
You can use the new color preferences to set the foreground text color and the background color in the Javadoc view and hovers:
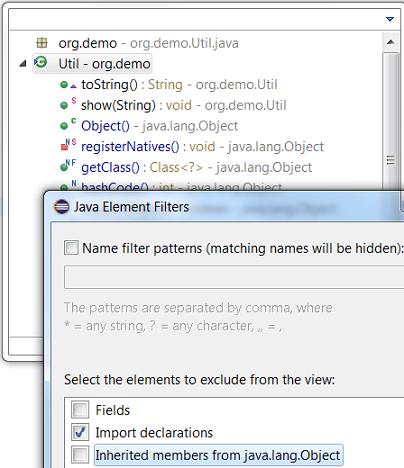
You can hide all inherited members from java.lang.Object in the Quick Outline (Ctrl+O) by using the new filter from the drop-down menu (Ctrl+F10):
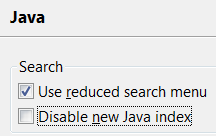
Eclipse Oxygen contains an experimental new Java index which is enabled by default. If you suspect an index-related problem, you can disable the new index from Preferences > Java:
Currently, the new index shouldn’t affect your experience. Once the work is finished, we expect big performance improvements for type hierarchies and in scenarios with many JARs.
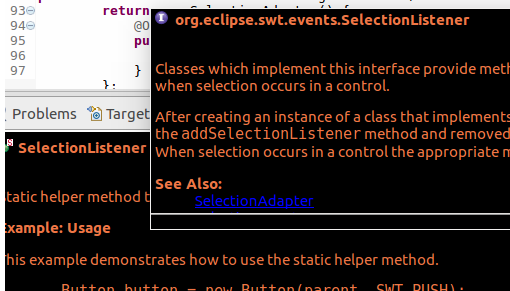
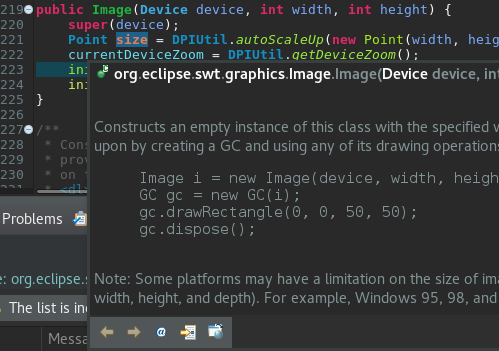
The Javadoc color usage on Linux was inconsistent since GTK 3.04. This has been resolved and support for Javadoc on the Eclipse Dark Theme has been added.
Before:
After:
Dark theme support:
The Open Implementation hyperlink and the Navigate > Open Implementation action now open the implementation of the selected interface or class also. In the past, Open Implementation was only available for methods.
The hyperlink popup shows up when you hold Ctrl (on the Mac: Command), unless you’ve changed the modifier on the Hyperlinking preference page.
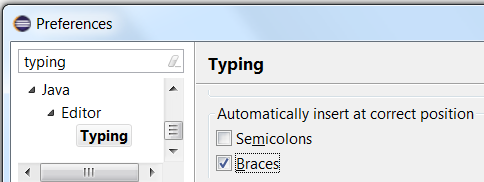
The Java > Editor > Typing > Automatically insert at correct position > Braces preference option is now enabled by default. This will automatically insert the braces where they are required.
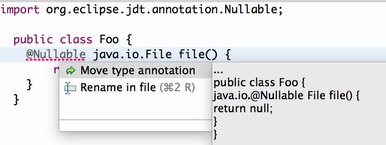
The rules for the placement of Java 8 "type annotations" introduced via JSR 308 are sometimes surprising. In case of errors, a new Quick Fix Move type annotation is offered, that moves the type annotation to a location that corresponds to what was probably intended.
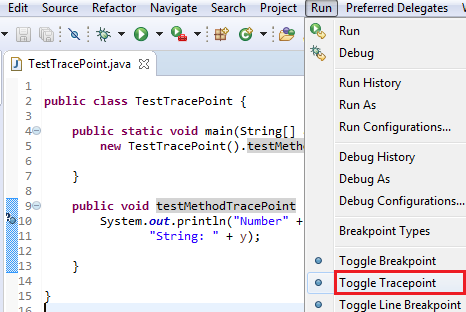
A new action Run > Toggle Tracepoint has been added.
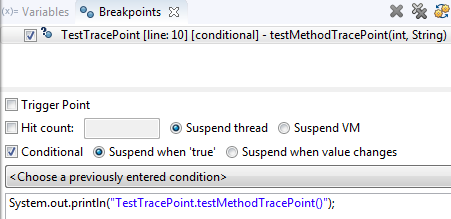
The action creates a conditional breakpoint using the "systrace" template, which prints the class and method name.
This makes use of another new feature of conditional breakpoints: As long as the condition doesn’t explicitly return a boolean true, the condition is now considered to implicitly return false, and the breakpoint will not suspend execution.
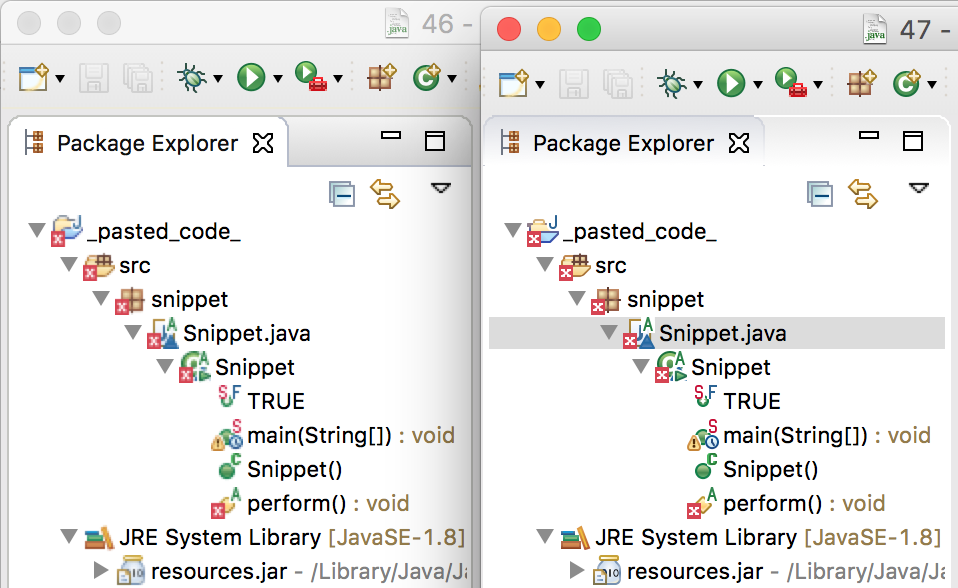
Composite icons such as Java element icons with modifier overlays are now rendered in high resolution in environments that support HiDPI images.
Many developers have learned the hard way, that certain uses of Java collections that pass the compiler’s type check, may still contain "type errors", resulting in unexpected runtime behaviour. A new analysis has been added to the Eclipse compiler for Java that will detect the most common bugs in this area.
The common reason behind this problem is the fact that not all methods of those collection types make use of generics in the way one might expect. As a result it is possible to create a Set<Short>, whose add(Short) method will only accept arguments of type Short, yet method remove(Object) will happily accept literally any argument, because the method’s parameter has type Object.
Here is a code snippet that seems to add and remove the same element from the set, but at a closer look the remove call has no effect. What is difficult to see for the naked eye is now flagged by a new warning:
In a simple world, this would be all there is to say, but over time people have developed various code patterns that rely on these overly general signatures. Consider the following use of subtyping:
Depending on your coding style this may or may not be accepted as a legitimate short hand for:
if (n instanceof Short) set.remove((Short) n);
To reduce the churn caused by the new analysis, we developed some heuristics that filter out cases where types are "sufficiently similar", so the above goes unwarned.
As with any heuristic, there is no clear line. This implies that the compiler may show "unwanted" warnings, or filter out invocations that are in fact bugs.
For the former case, @SuppressWarnings("unlikely-arg-type") will document the exception both for the user and for the compiler.
For the latter case, we provide an option to tighten the rules, namely to apply strict type compatibility checks instead of said heuristics.
For this extra scrutiny you may enable the sub-option Perform strict analysis against the expected type in Preferences > Java > Compiler > Errors/Warnings > Potential programming problems.
Similarly, a check with default severity "Info" is offered for unlikely invocations of java.lang.Object.equals(Object) and java.util.Objects.equals(Object,Object).
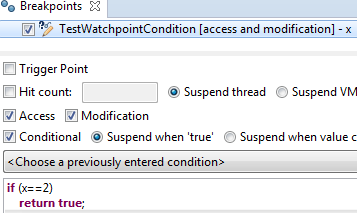
Like for line breakpoints, conditions can now also be added to Watchpoints, where the old value of the field can be used as part of the condition.
A new option has been added in the code formatter profile editor that makes the formatter count a comment’s width from its starting position instead of the beginning of the line. This allows more space for comments in heavily indented blocks of code and for line comments added to the right of some code, but at the same time keeps comments that start at the beginning of the line from getting too wide and uncomfortable to read. You can change this setting in the Comments section, under the Line width group:
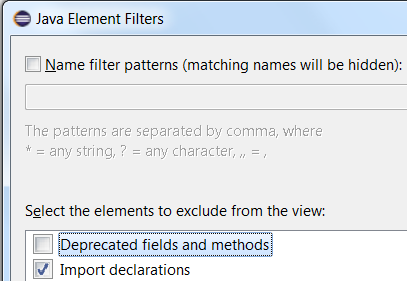
You can now hide the deprecated fields and methods in Outline view, Members view, Package Explorer view, Project Explorer view, and Quick Outline by using the new filter from their drop-down menu (Ctrl+F10):
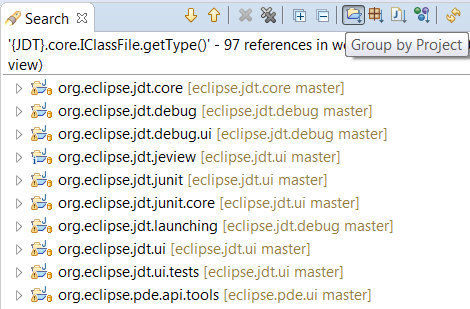
The default grouping of Java search results in the Search view has been changed to Group by Project. Earlier the results were grouped by package.
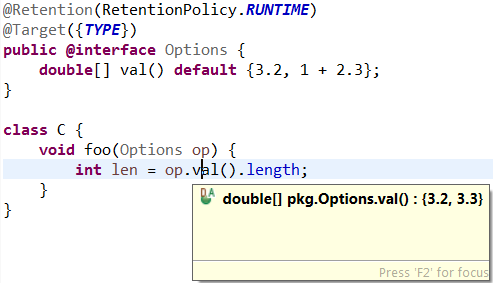
The default value of an annotation type element is now shown in the Javadoc view and hover.
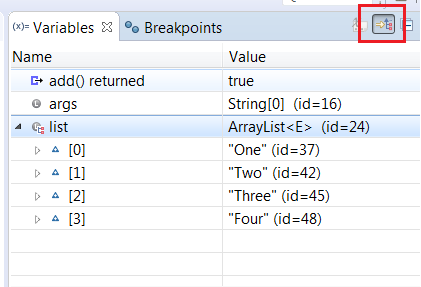
In the Variables view, Show Logical Structure is now enabled by default. E.g. collection objects now directly show their contained elements instead of their internal structure.
The Show Logical Structure context menu lets you choose or edit the representation.
You can now pass compiler options to annotation processors using %variable% syntax in Project > Properties > Java Compiler > Annotation Processing.
This allows processors to compile Java sources using the Java project’s settings without manually maintaining this information in the processor options.
You can find more noteworthy updates in on this page.


