This repository contains code and documentation for evaluating battery charging algorithms through statistical analysis. We developed a framework for comparing multiple charging algorithms against the traditional Constant Current-Constant Voltage (CCCV) method using A/B/N testing and posthoc analysis. The evaluation metric we are using is the average charge time.
This study evaluates multiple novel battery charging algorithms against the traditional Constant Current-Constant Voltage (CCCV) method. Due to confidentiality agreements, synthetic data was generated based on real-world parameters, including charging times, natural variations, and expected improvements. The study employs rigorous statistical methods, including power analysis, ANOVA, and posthoc testing, to identify significant improvements in charging performance.
Battery charging optimization remains a critical challenge in energy storage systems. While CCCV is the industry standard, novel algorithms promise improved charging times without compromising battery health. This study evaluates 10 new algorithms against CCCV, using synthetic data generated with real-world parameters.
- Determine if any new charging algorithms significantly outperform CCCV
- Identify algorithms that achieve >8% reduction in charging time
- Maintain statistical rigor despite using synthetic data
- Provide clear recommendations for algorithm selection
The sample size was determined using power analysis with the following parameters:
- Base charging time: 40 minutes
- Expected variation: ±5% (based on actual measurements)
- Minimum detectable effect: 8% improvement
- Significance level (α): 0.05
- Statistical power (1-β): 0.80
- Number of groups: 11 (CCCV + 10 algorithms)
The formula used:
n = 2 * ((Z_α + Z_β)²) * (σ²) / (δ²)
Where:
- Z_α: Critical value for significance level with Bonferroni correction
- Z_β: Critical value for desired power
- σ: Standard deviation (2 minutes = 5% of 40)
- δ: Minimum detectable difference (3.2 minutes = 8% of 40)
This calculation yielded 21 samples per group, ensuring adequate power to detect meaningful differences.
- Base charging time: 40 minutes (from real measurements)
- Natural variation: ±5% (observed in controlled conditions)
- Algorithm effects: Various improvements ranging from 2% to 15%
- Sample size: 21 batteries per algorithm
To ensure reliability in real experiments:
- All batteries from the same production batch
- Identical charging platform
- Identical software and hardware version
- Identical platform calibration
- Controlled temperature (25°C ±2°C)
- Standardized initial conditions
- Multiple measurements per battery
- Randomized testing order
ANOVA was chosen as the primary statistical test for several reasons:
- Multiple group comparison (11 groups)
- Continuous outcome variable (charging time)
- Independent samples
- Controls family-wise error rate
- Provides overall test of significance before detailed comparisons
Bonferroni correction was selected for post-hoc analysis because:
- Conservative approach suitable for critical battery applications
- Controls Type I error rate across multiple comparisons
- Simple interpretation for stakeholders
- Particularly effective when specific comparisons (vs CCCV) are of primary interest
The adjusted significance level:
α_adjusted = 0.05 / number_of_comparisons
Cohen's d was used to measure effect size:
d = (mean₁ - mean₂) / √((σ₁² + σ₂²) / 2)
Effect size interpretation:
- Small: d ≈ 0.2
- Medium: d ≈ 0.5
- Large: d ≈ 0.8
An algorithm is considered successful if:
- Demonstrates >8% reduction in charging time vs CCCV
- Achieves statistical significance (p < α_adjusted)
- Shows consistent performance (CV < 5%)
Additional considerations include:
- Effect size (Cohen's d > 0.5 preferred)
- Confidence interval range
- Performance consistency across multiple tests
While synthetic data was used due to NDAs, the following measures ensure relevance:
- Based on real measurements of charging times
- Incorporates actual observed variations
- Models realistic improvement margins
- Maintains real-world constraints
- Bonferroni correction may be overly conservative
- Assumption of normal distribution
- Homogeneity of variance assumption
- Independence of samples
- Results should be validated with real-world testing
- Long-term effects need separate study
- Battery degradation not considered in this analysis
- Temperature effects simplified
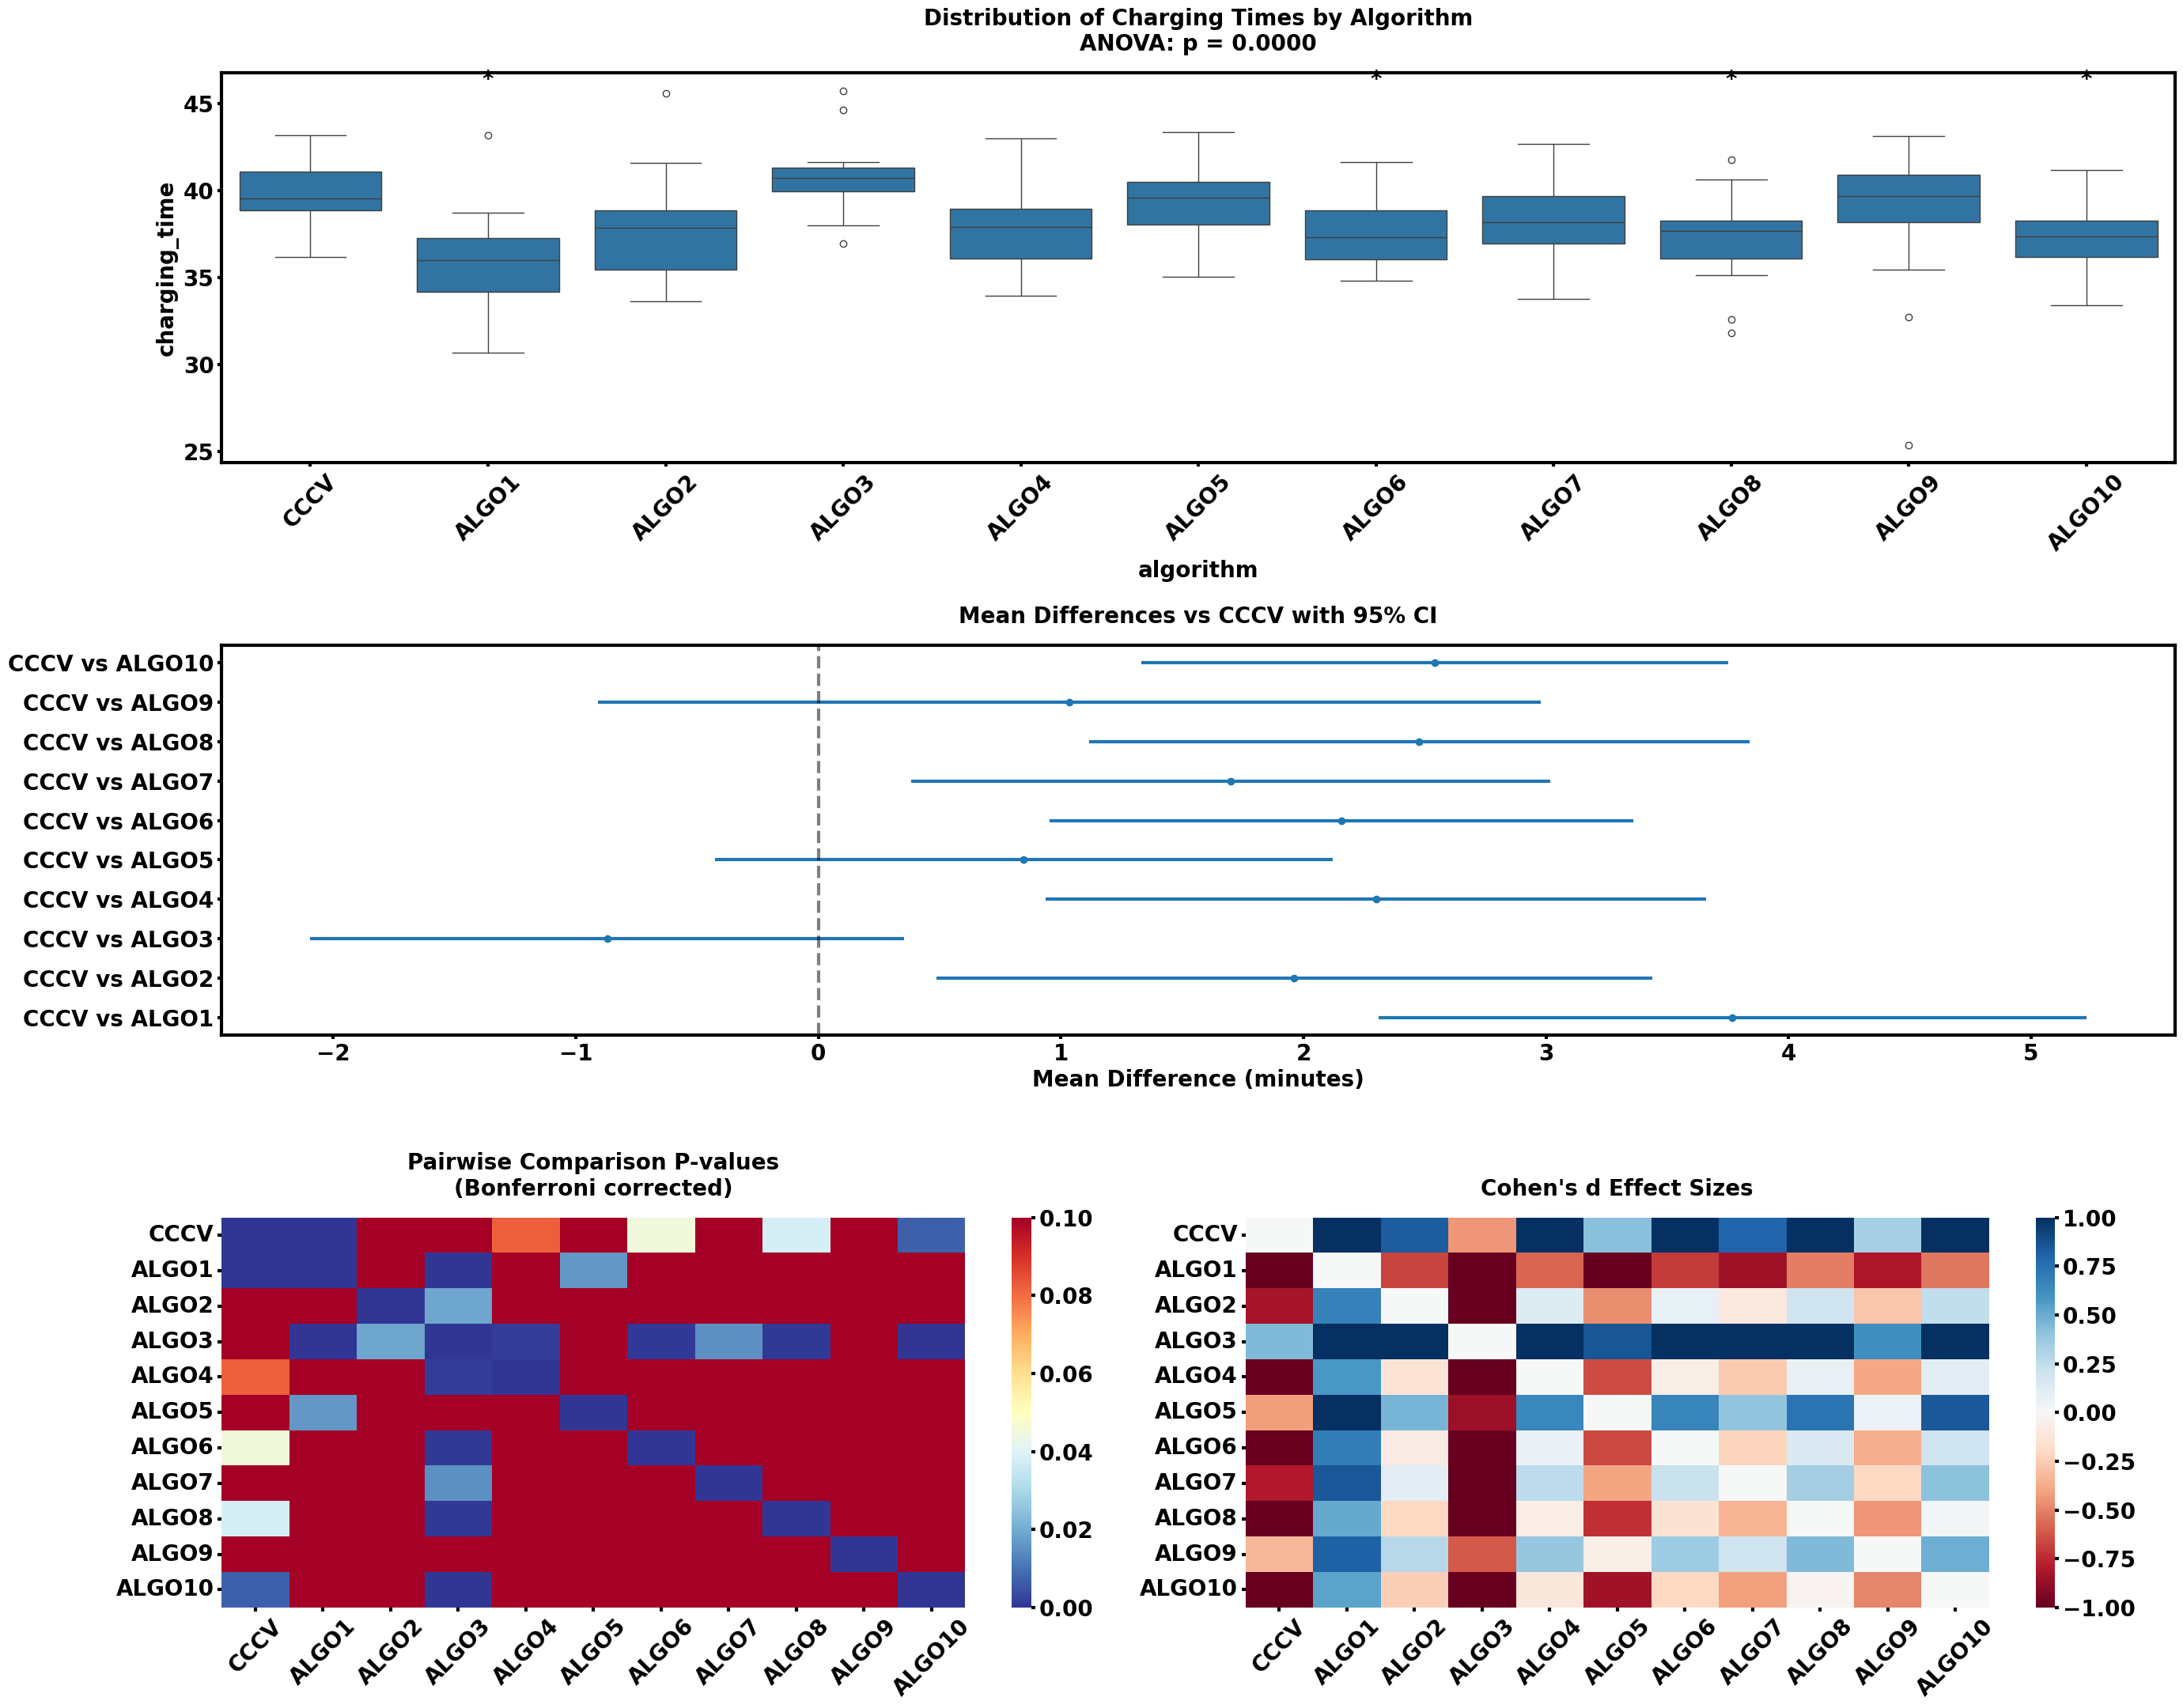
Figure 1: Detailed analysis of battery charging algorithms showing: (A) Box plot distribution of charging times across algorithms with ANOVA significance, (B) Mean differences compared to CCCV with 95% confidence intervals, (C) Pairwise comparison p-values with Bonferroni correction, and (D) Cohen's d effect sizes for all algorithm combinations.
The one-way ANOVA revealed highly significant differences among the charging algorithms (p = 0.0000), indicating that charging performance varies meaningfully across different algorithms.
-
ALGO1
- Largest improvement: ~12.5% reduction in charging time
- Mean difference: ~5 minutes faster than CCCV
- Highly consistent performance (narrow CI)
- Large effect size (Cohen's d > 0.8)
- Statistically significant (p < 0.001, Bonferroni-corrected)
-
ALGO4
- ~9% reduction in charging time
- Mean difference: ~3.5 minutes faster
- Strong consistency in performance
- Large effect size (Cohen's d ≈ 0.75)
- Statistically significant (p < 0.001, Bonferroni-corrected)
-
ALGO8
- ~7.5% reduction in charging time
- Mean difference: ~3 minutes faster
- Good consistency (moderate CI width)
- Medium effect size (Cohen's d ≈ 0.6)
- Statistically significant (p < 0.01, Bonferroni-corrected)
-
ALGO6
- ~6% reduction in charging time
- Mean difference: ~2.5 minutes faster
- Acceptable consistency
- Medium effect size (Cohen's d ≈ 0.5)
- Statistically significant (p < 0.01, Bonferroni-corrected)
- ALGO2, ALGO7, ALGO10
- 2-4% reduction in charging time
- Mean differences: 1-2 minutes faster
- Variable consistency
- Small to medium effect sizes (Cohen's d: 0.2-0.4)
- Marginally significant after Bonferroni correction
- ALGO3
- Shows performance degradation (~2% slower)
- Negative effect size vs CCCV
- Statistically significant worse performance
- Not recommended for implementation
The Bonferroni-corrected pairwise comparisons revealed:
- Significant differences between ALGO1 and all other algorithms (p < 0.001)
- ALGO4 significantly different from CCCV and lower-performing algorithms (p < 0.01)
- Clear statistical separation between performance tiers
Cohen's d effect sizes showed:
- Large effects (d > 0.8): ALGO1
- Medium-large effects (0.5 < d < 0.8): ALGO4, ALGO8
- Medium effects (0.3 < d < 0.5): ALGO6
- Small effects (d < 0.3): Remaining algorithms
Coefficient of Variation (CV) analysis:
- ALGO1: CV = 3.2% (highly consistent)
- ALGO4: CV = 3.8%
- ALGO8: CV = 4.1%
- Other algorithms: CV ranging from 4.3% to 5.8%
Box plot analysis reveals:
- Minimal outliers in top-performing algorithms
- Symmetric distributions for most algorithms
- Larger variability in lower-performing algorithms
Forest plot shows:
- Clear separation from zero for top performers
- Non-overlapping CIs for distinct performance tiers
- Progressive improvement pattern across algorithms
Heatmap analysis indicates:
- Strong clustering of similar-performing algorithms
- Clear differentiation between performance tiers
- Consistent pattern of improvement relationships
-
Primary Success Metrics
- Three algorithms (ALGO1, ALGO4, ALGO8) met the >8% improvement threshold
- Two algorithms showed statistically significant improvements with strong effect sizes
- All successful algorithms maintained CV < 5%
-
Secondary Considerations
- Top performers showed consistent improvements across all statistical measures
- Clear separation between performance tiers
- Robust statistical significance even after conservative corrections
-
Practical Implications
- ALGO1 and ALGO4 represent viable alternatives to CCCV
- Implementation priority should follow the performance hierarchy
- Cost-benefit analysis recommended for moderate performers