This project follows the guildance from Datacamp courses to develop a complete Power BI report starting from the data integration from multiple sources, data transformation, modeling, and then visualization.
In this part, I start exploring and integrating the dataset into Power BI and understand the challenges faced with the uncleaned data.
Then, using Power Query Editor operations, II will clean and mash up the data to use it for reporting.
Case study scenario:
- Analyze manufacture’s sales internally
- Comparing sales against other competitors
- Comparing product performance against other competitors
- Load all the required data.
- Clean and explore by removing unnecessary columns. Replace null values by fill-down function.
- Split the values by "Columns from example" and ensure the data types are correctly formatted.

- Remove uncessary rows. Transpose the table to ensure correct structure.
- Append the queries: combine both Sales tables and create a single table that analyzes sales for all countries.
- Have a quick exploratory analysis by suing (View - Column Profile - Column Statistics and Value Distribution)

- Review the last 3 years by Filter Rows.
- Create Clustered Column Charts to determine which manufactures generate most value.

- Setting up relationship between tables1
- Create new calculate by DAX
Date = CALENDAR(DATE(2017,1,1), DATE(2021,12,31))
- Using top N list to identify major competitors.
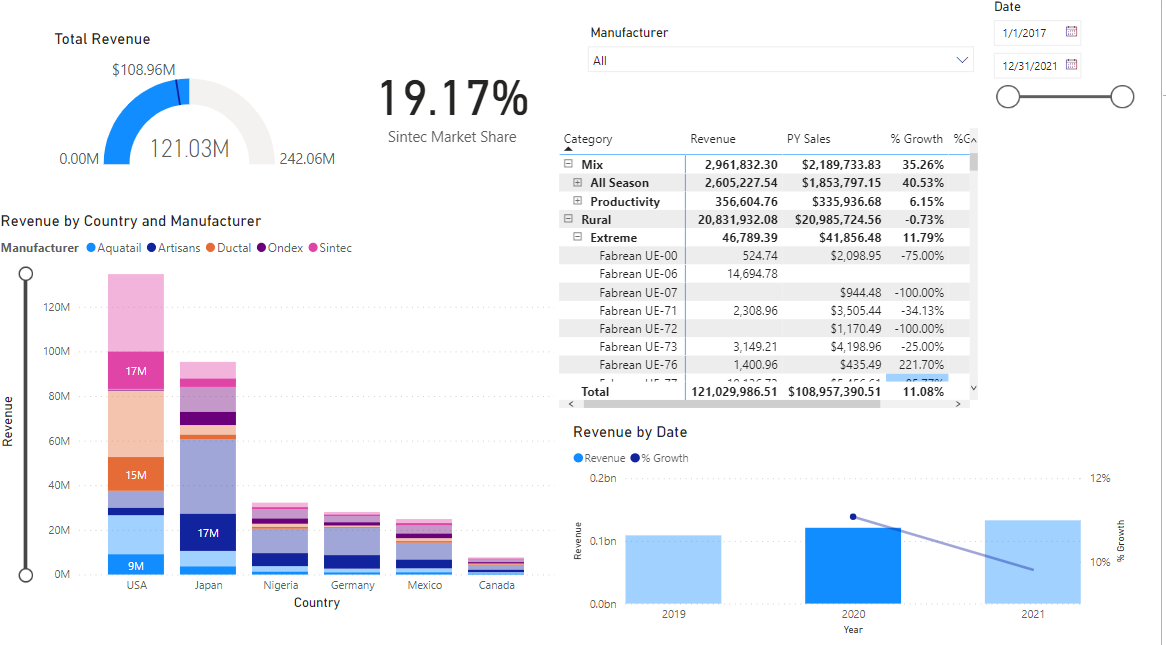
- Choosing the Stacked column chart to see how the values of each manufacturer contribute to the totals.
- Select an appropriate visual that displays Revenue over time (Clustered Column chart). Add slicers and ensure Data labels, Target labels, and Callout value are all enabled.
- Add some more dimensions and create a hierarchy of Category, Segment, Product to analyze in-deep about Revenue (using Matrix visual)
- To show the sales growth and the rate at which a product can increase the revenue from sales, using DAX calculations. Select the maxtrix visual and drag PY Sales and %Growth in values section.
- Apply conditional formatting rule
- 0-40%: Red
- 41-60%: Yellow
- More than 60%: Light Blue
Sintec’s marketing department has asked to keep the report design and UI in line with the company’s standard guidelines and provide with a color theme. In this project, I use Sunset theme to make the report look cleaner and more professional.
- Change the manufacturer slicer from drop down to list. Add the actual logos of the manufacturer into slicer.
- Upload customized theme. Add title and change font.
- Using bookmarks and Spotlights feature will highlight specific visuals and present them in a story.
- Apply advanced AI-based visualizations to make analyze more robust.
- Add more functionality of drillthrough to help end users focus on a specific entity.
- Complete the analysis and reporting using Power BI's Analyze feature to explain the increase or decrease seen on charts.


- Sintec has total market share of 38.22% in the USA.
- The highest growth of 18.8% in 2021 compared to last year.
- Artisans is generating revenue with over 50% of the market share in Germany.
- Sintec has 21.15% of the total market share across the globe.