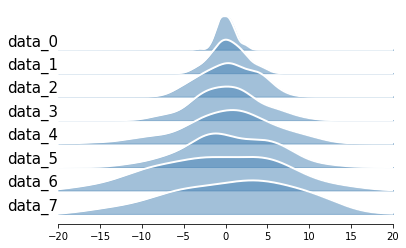
This is a simple module for plotting ridgeplot with the scipy ecosystem.
Ridgeplot is a great data visualization technique to compare distributions from multiple groups at the same time, and was first introduced in 2017 as joy plot:
I hereby propose that we call these "joy plots" #rstats https://t.co/uuLGpQLAwY
— Jenny Bryan (@JennyBryan) April 25, 2017
ridgeplot-py provides a simple API to produce matplotlib-compatible ridgeplots, as well as a handy ColorEncoder class with scikit-learn syntax for manipulating color annotations in a consistent way [through out manuscripts or presentations].
git clone git@github.com:wckdouglas/ridgeplot-py.git
cd ridgeplot-py
python setup.py install
or via conda:
conda install -c conda-forge ridgeplot-pyor via pypi:
pip install ridgeplot-pyfrom ridgeplot import ridgeplot
from ridgeplot.colors import ColorEncoder, ColorPalette
import numpy as np
import matplotlib.pyplot as plt
# mocking some data
# the input data should be a dict of
# - keys: group names for the distributions
# - values: list of values
data = {}
for i in range(8):
data['data_{}'.format(i)] = np.random.randn(100) * (i+1)
# make the plot
fig = plt.figure()
ax = fig.add_subplot(111)
ridgeplot(
ax,
data,
xlim=(-20,20),
label_size=15
)A notebook showing quick howto is included in this repo!
scipy may cause error and may be able to solved by the this stackoverflow answer:
brew install openblas
export OPENBLAS="$(brew --prefix openblas)"
poetry install
